
$ cd ~/talks/profiling-javascript-performance
Profiling JavaScript Performance
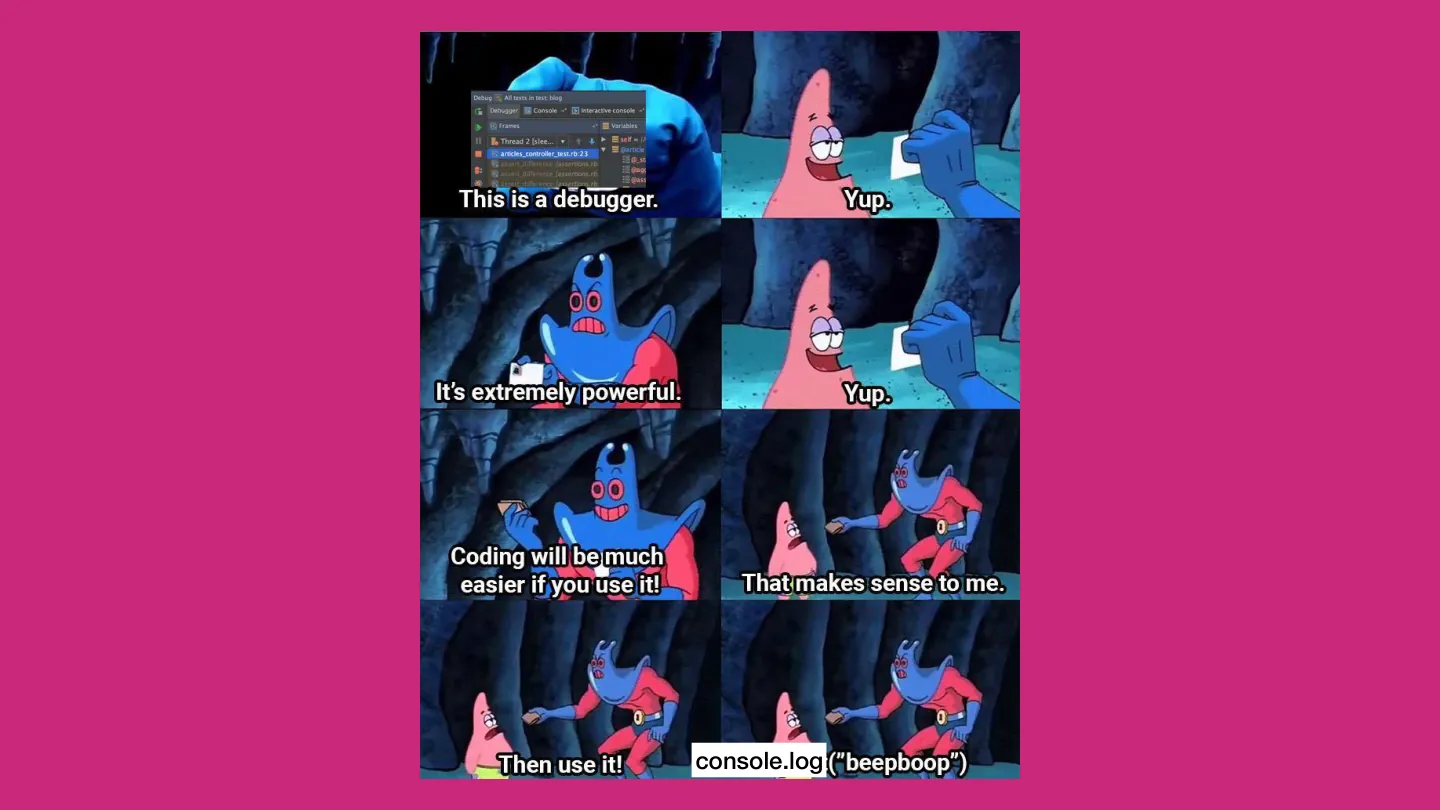
A beginner's tour of the Chrome profiler: finding bottlenecks in your JavaScript without leaning on console.log.
$ open slides







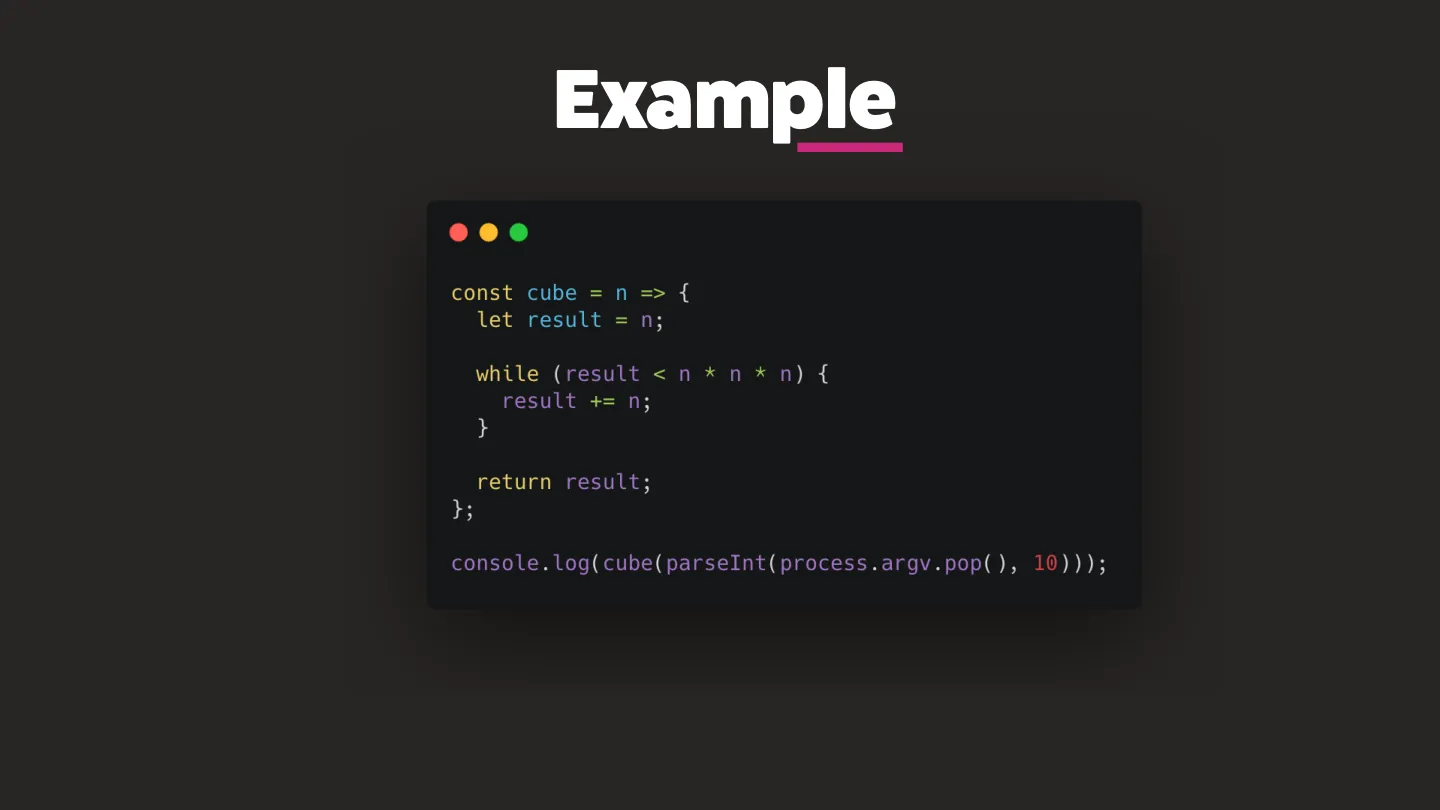









$ cat notes.md
JavaScript has a low barrier to entry, which is great, and it’s also why so much slow JavaScript ships without anyone noticing. This talk was a beginner’s look at the profiler, so you can find the slow parts instead of guessing at them.
How JavaScript runs
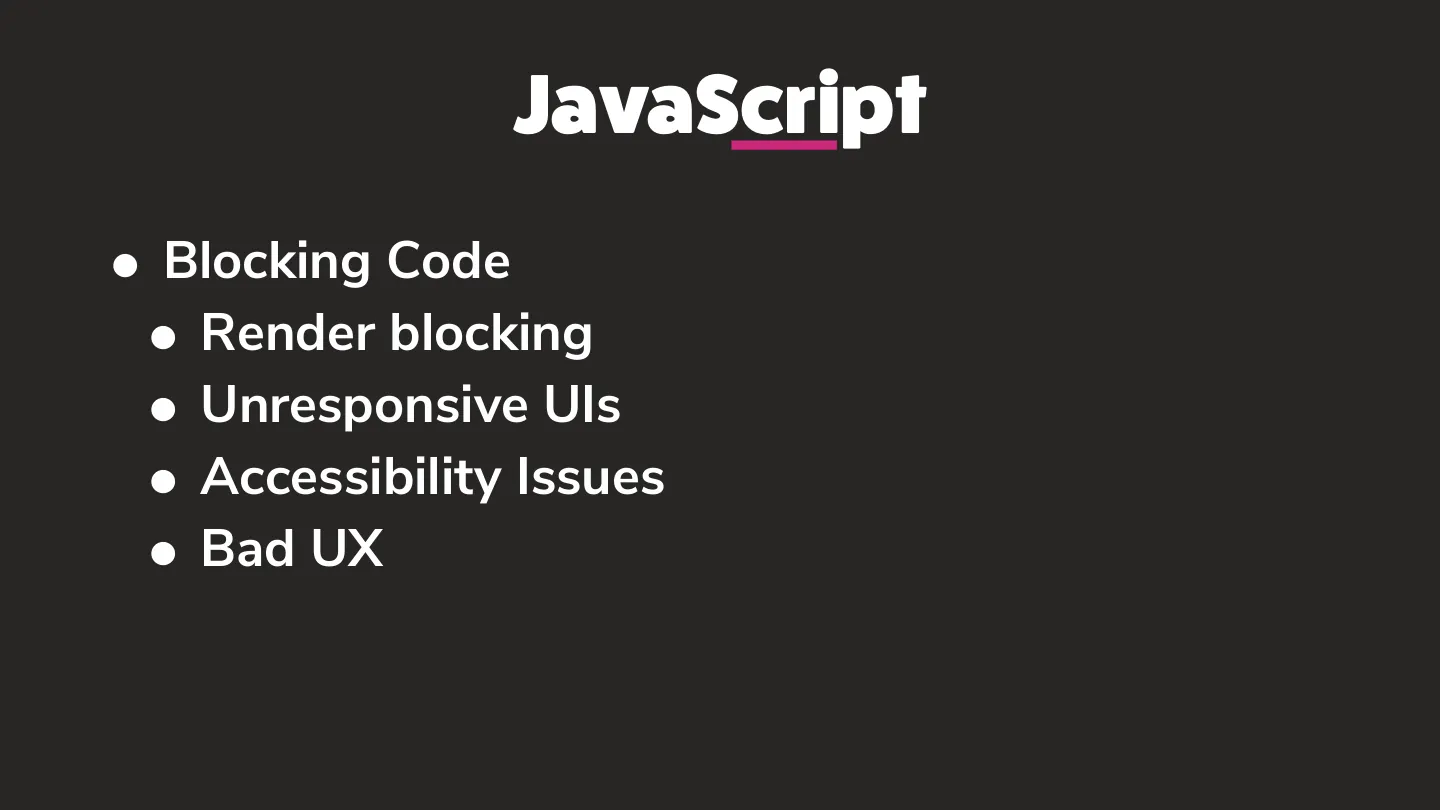
- It’s single threaded: one chunk of work at a time. Blocking code means render blocking, unresponsive UIs, accessibility issues and a bad experience.
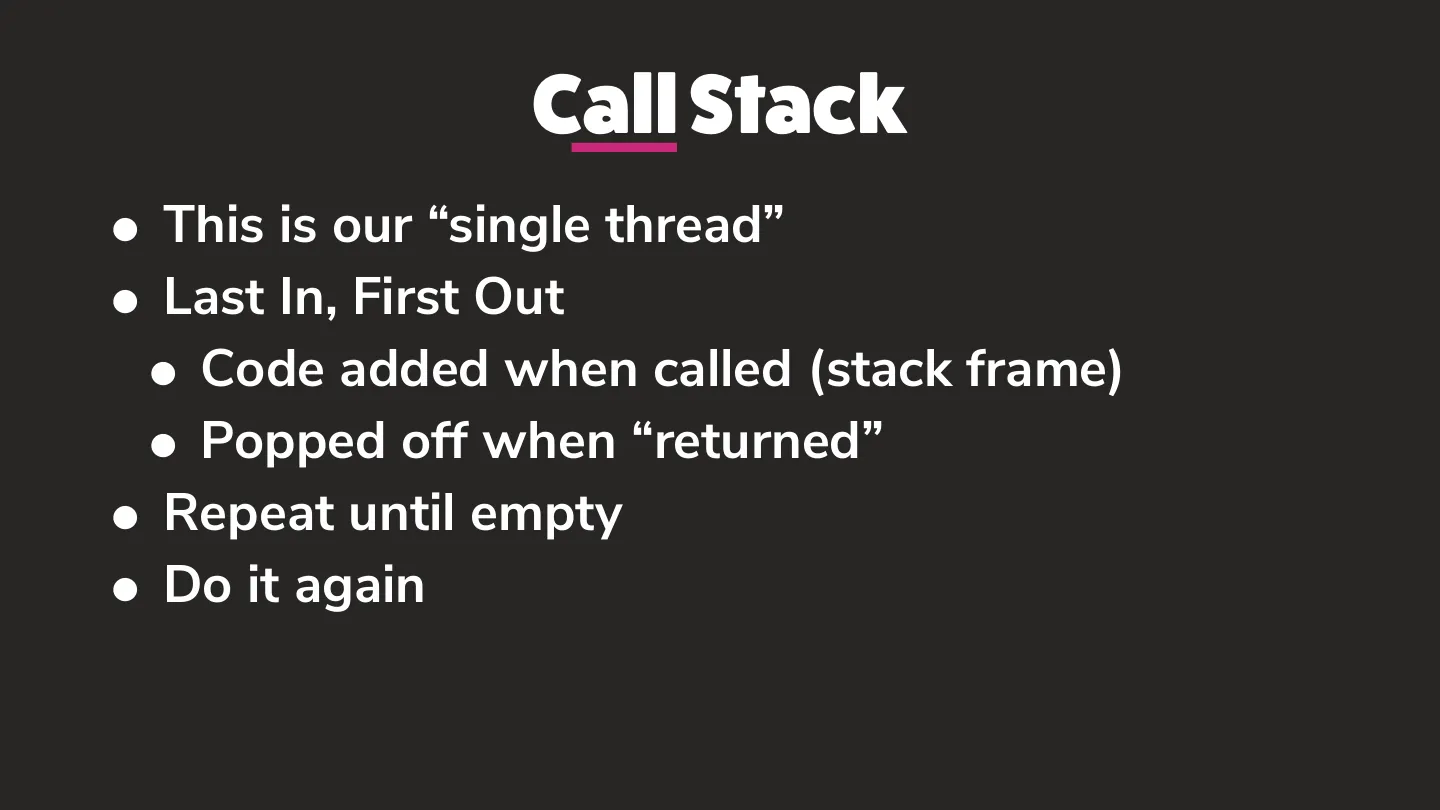
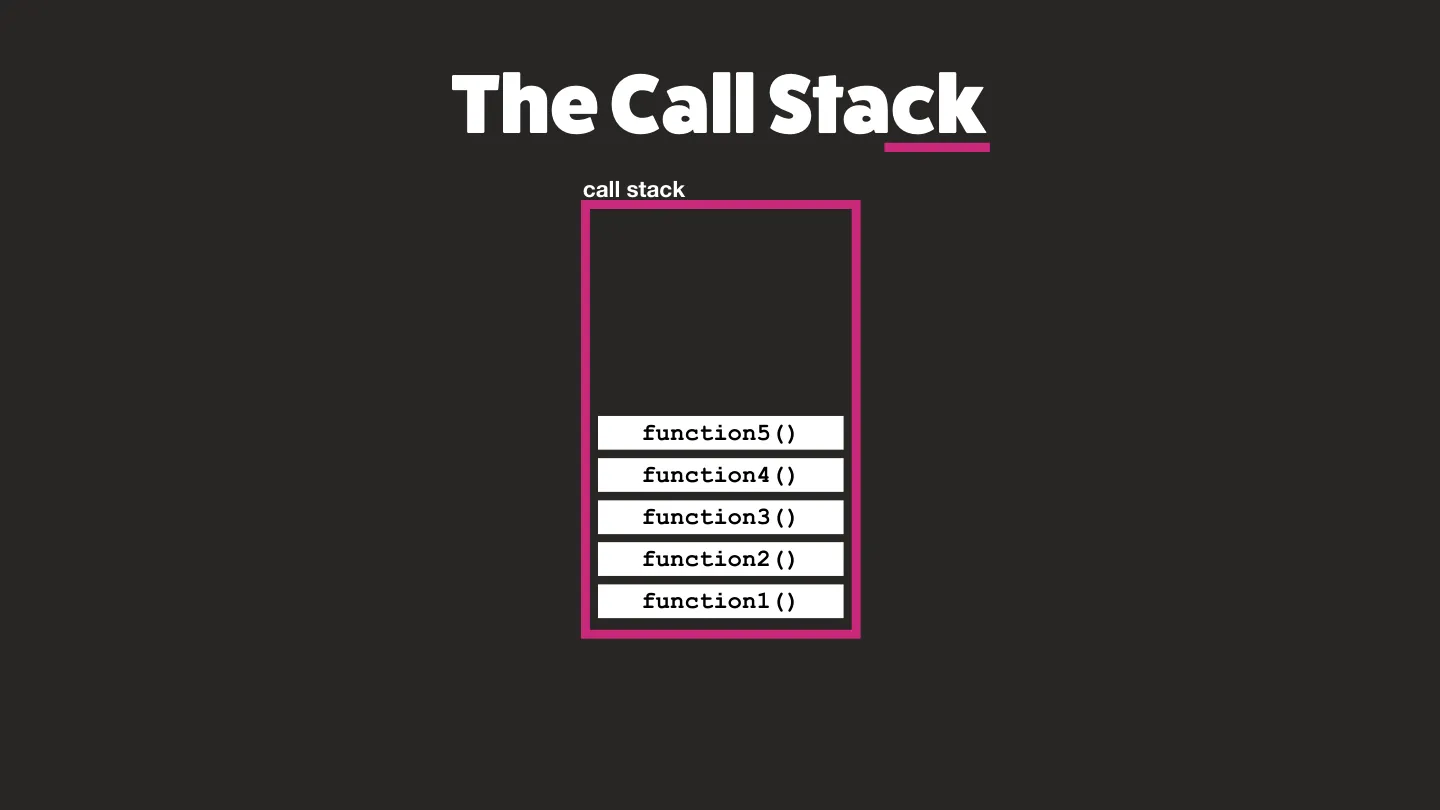
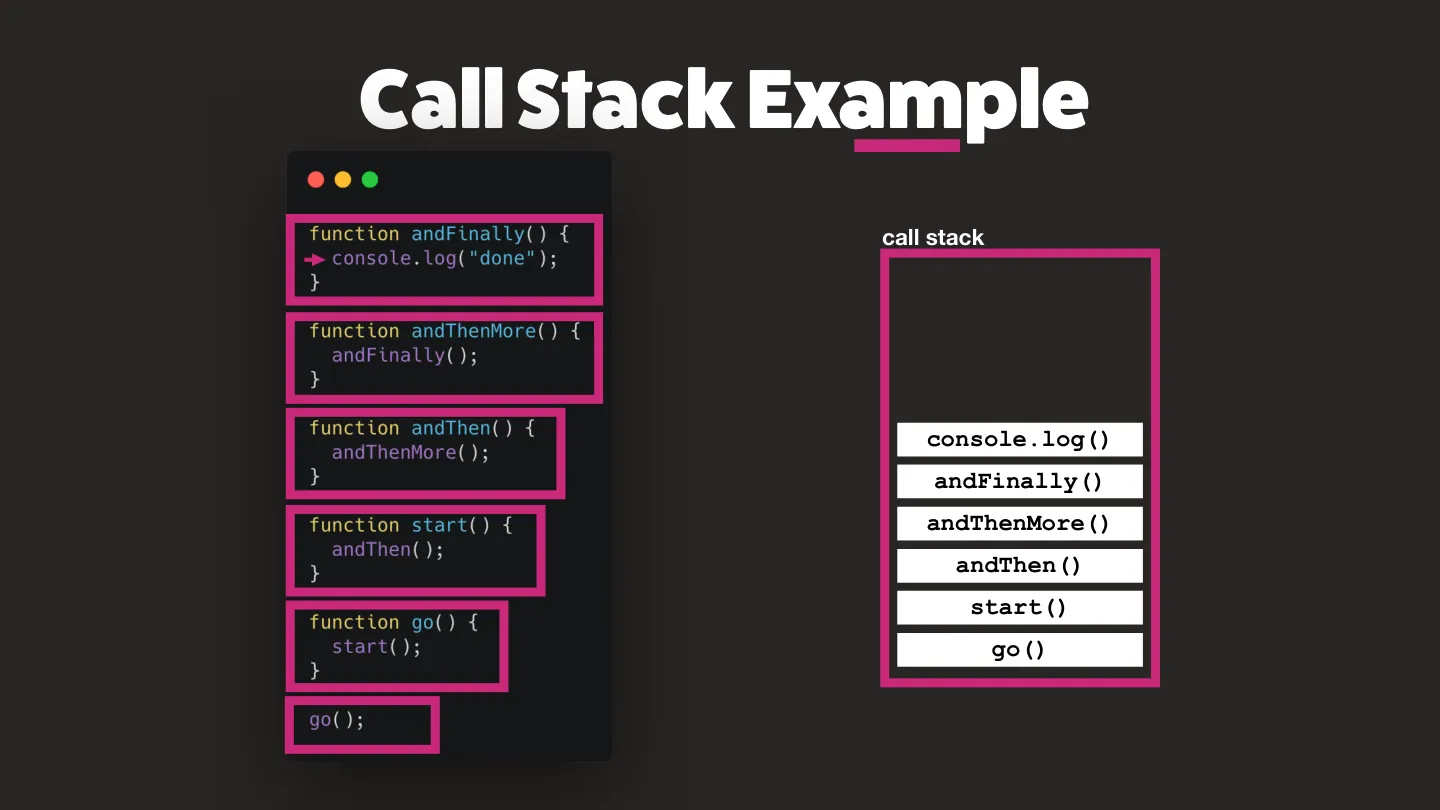
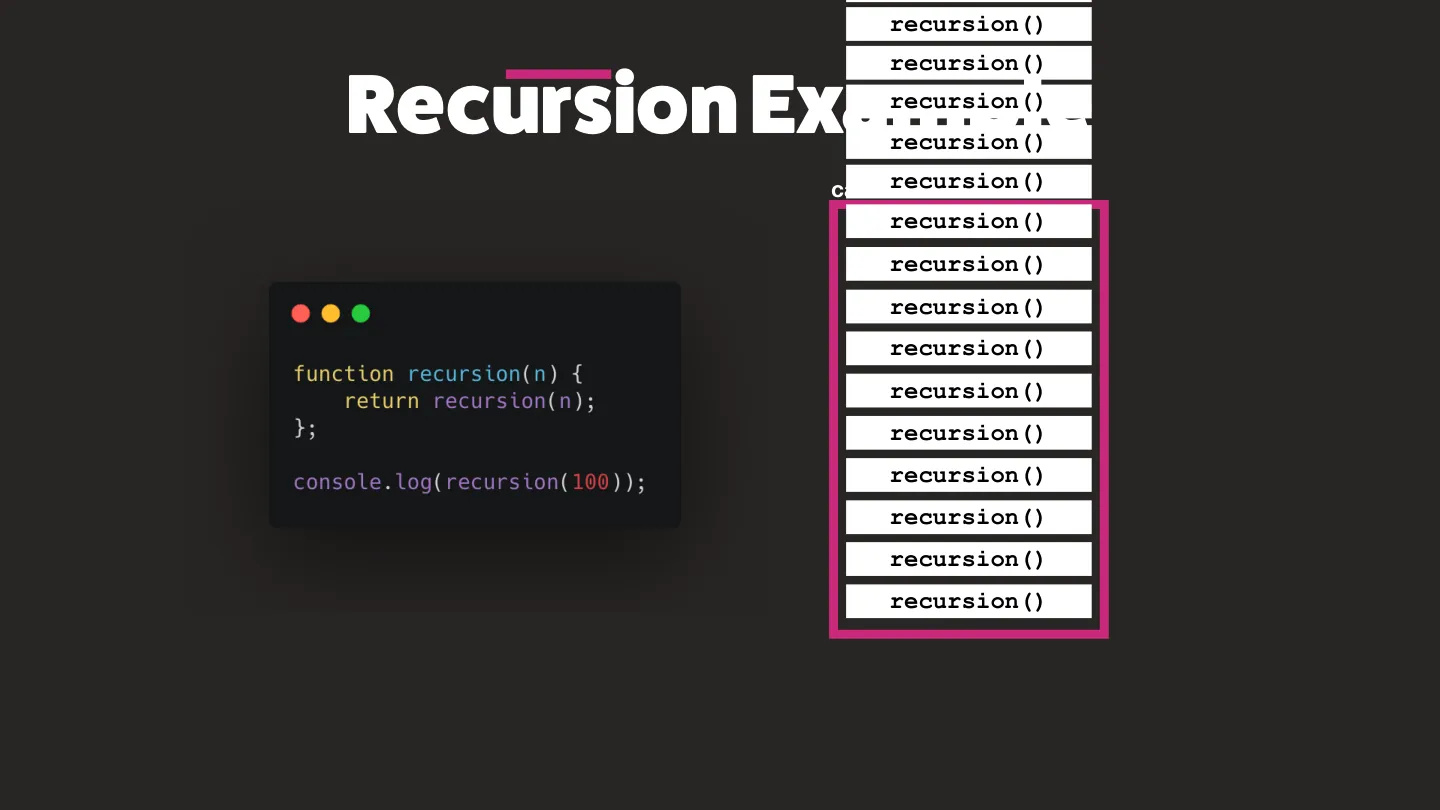
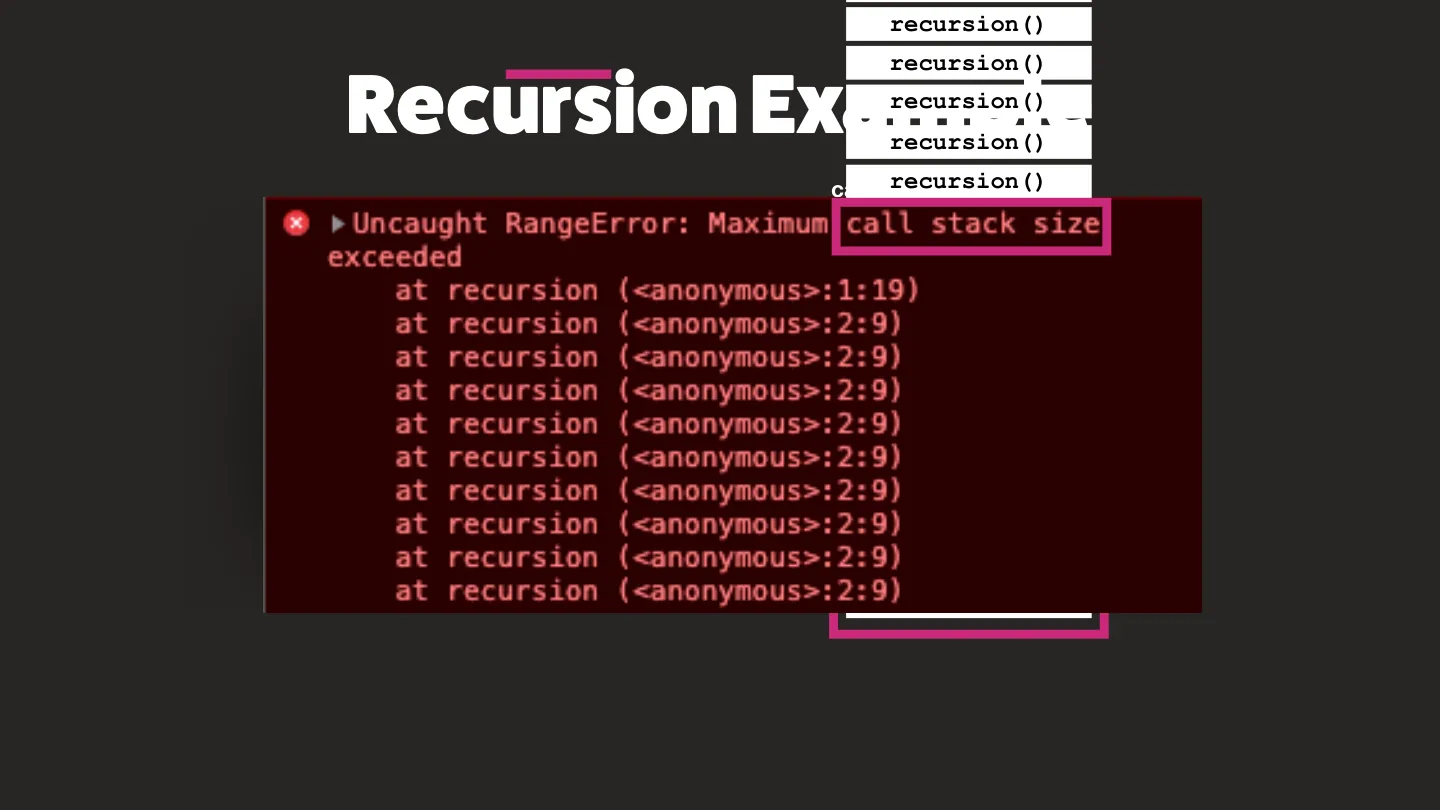
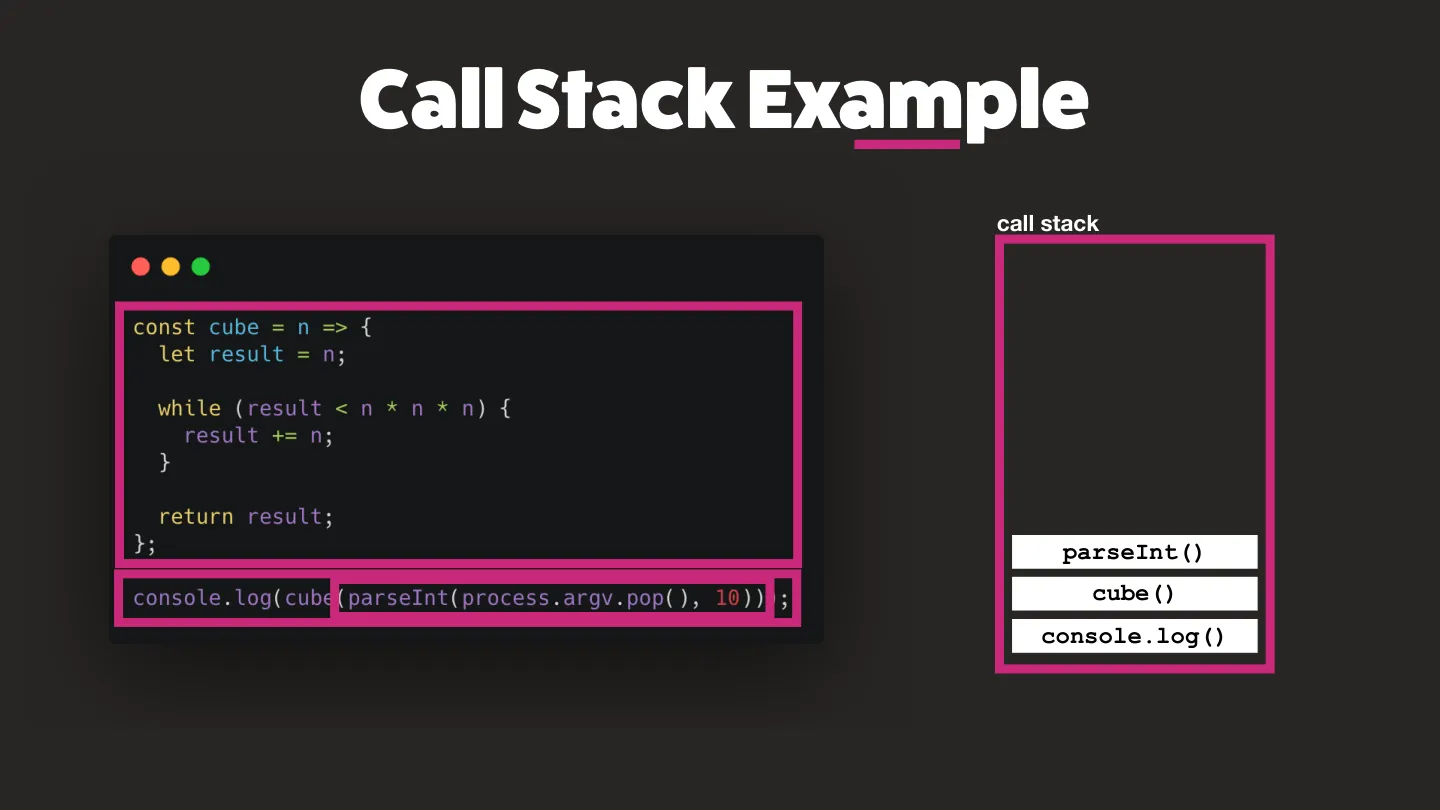
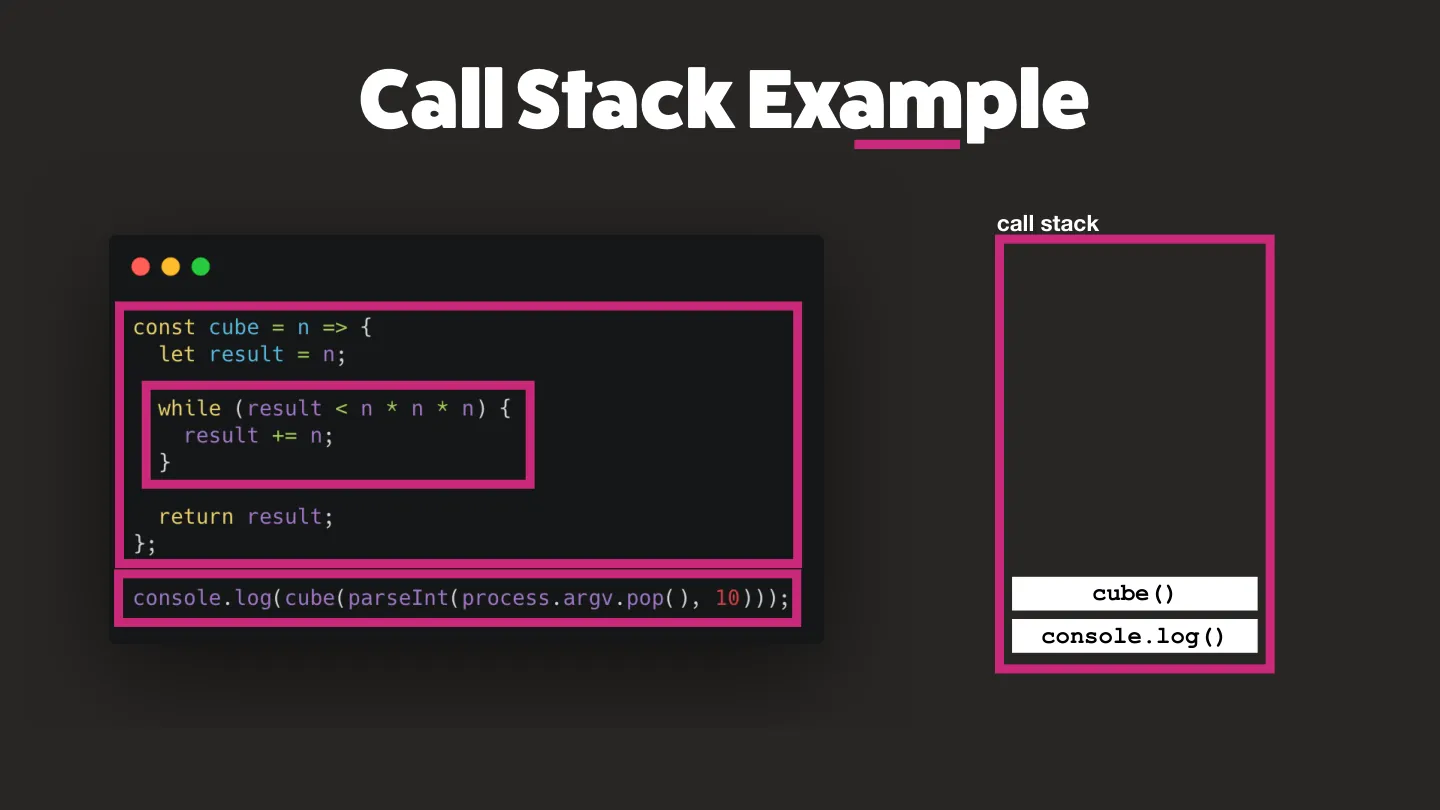
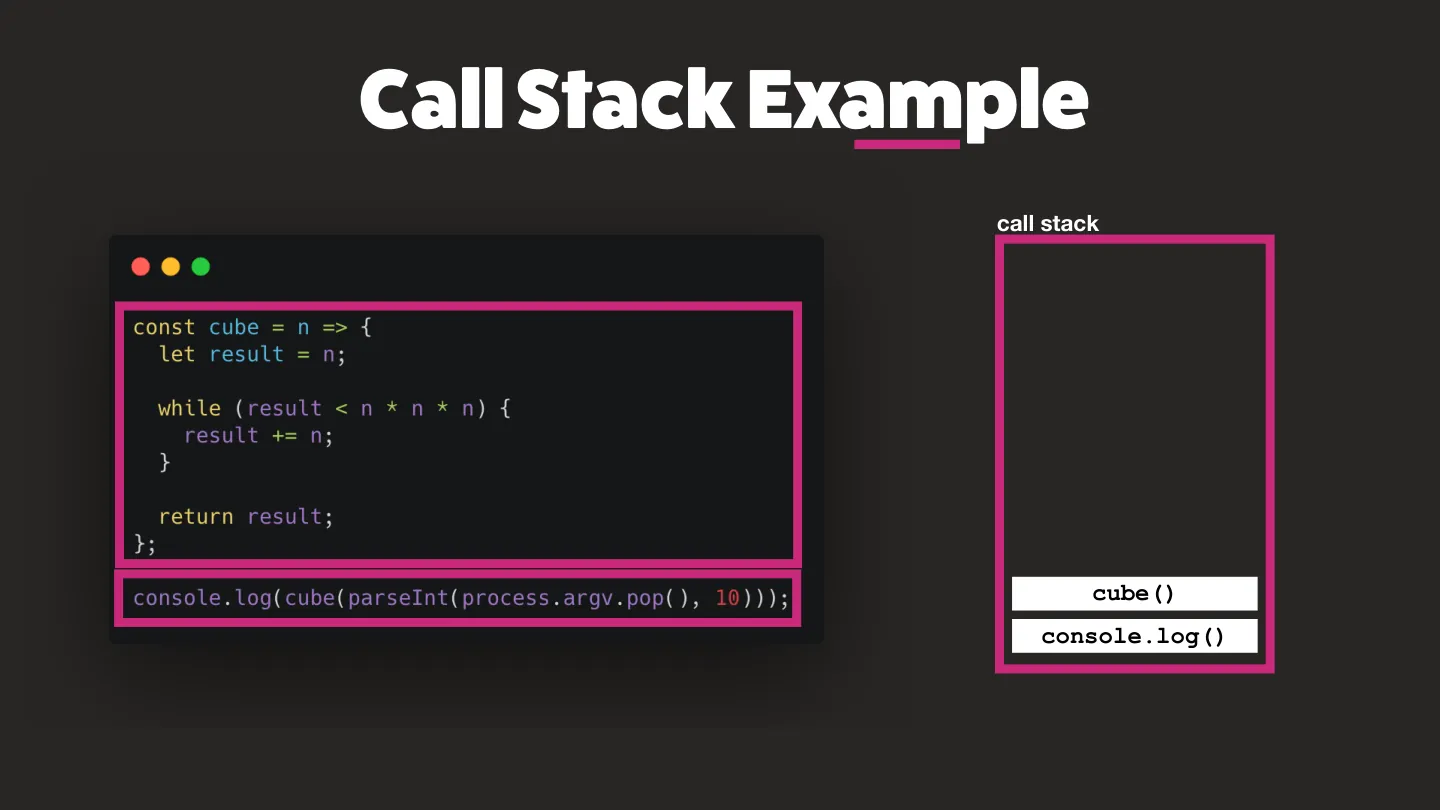
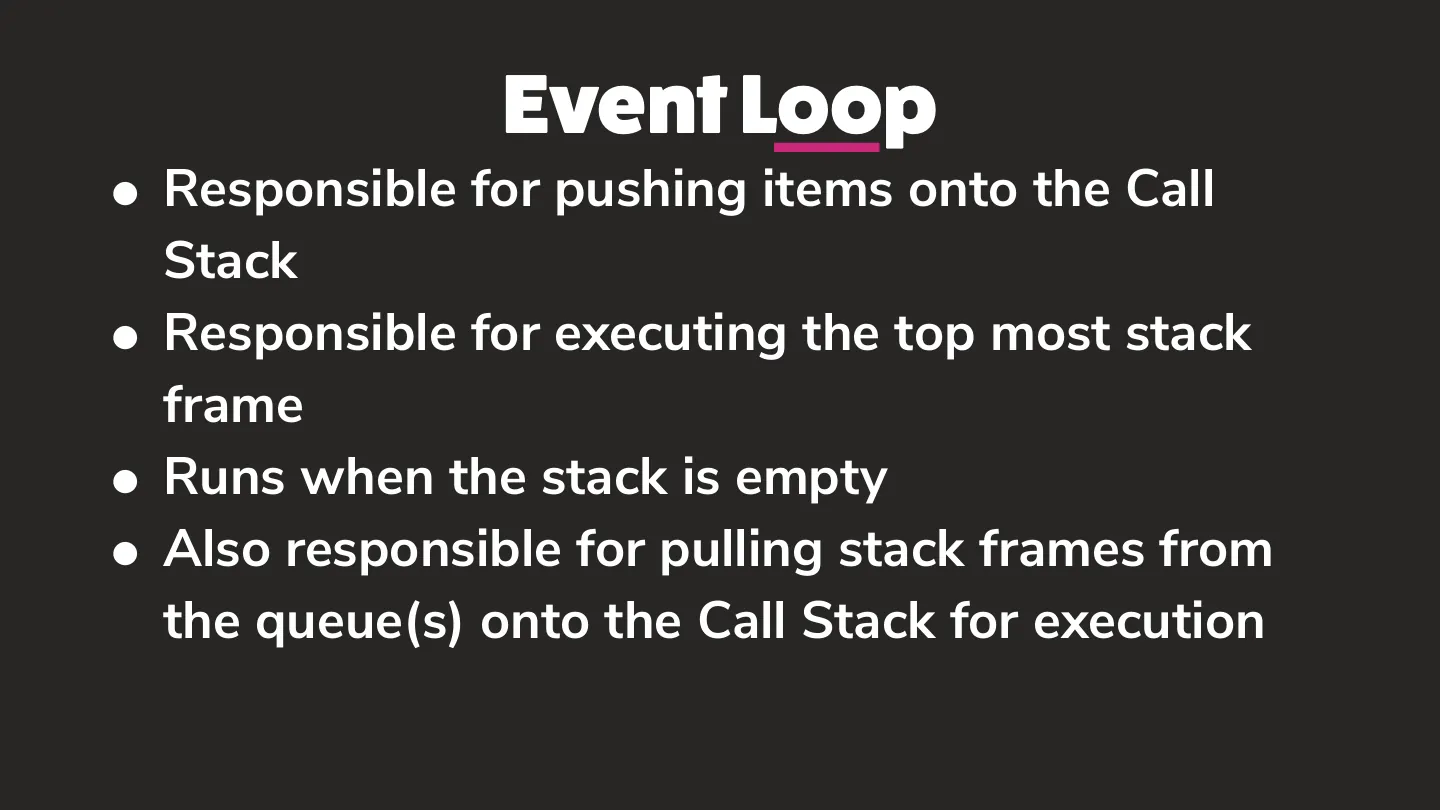
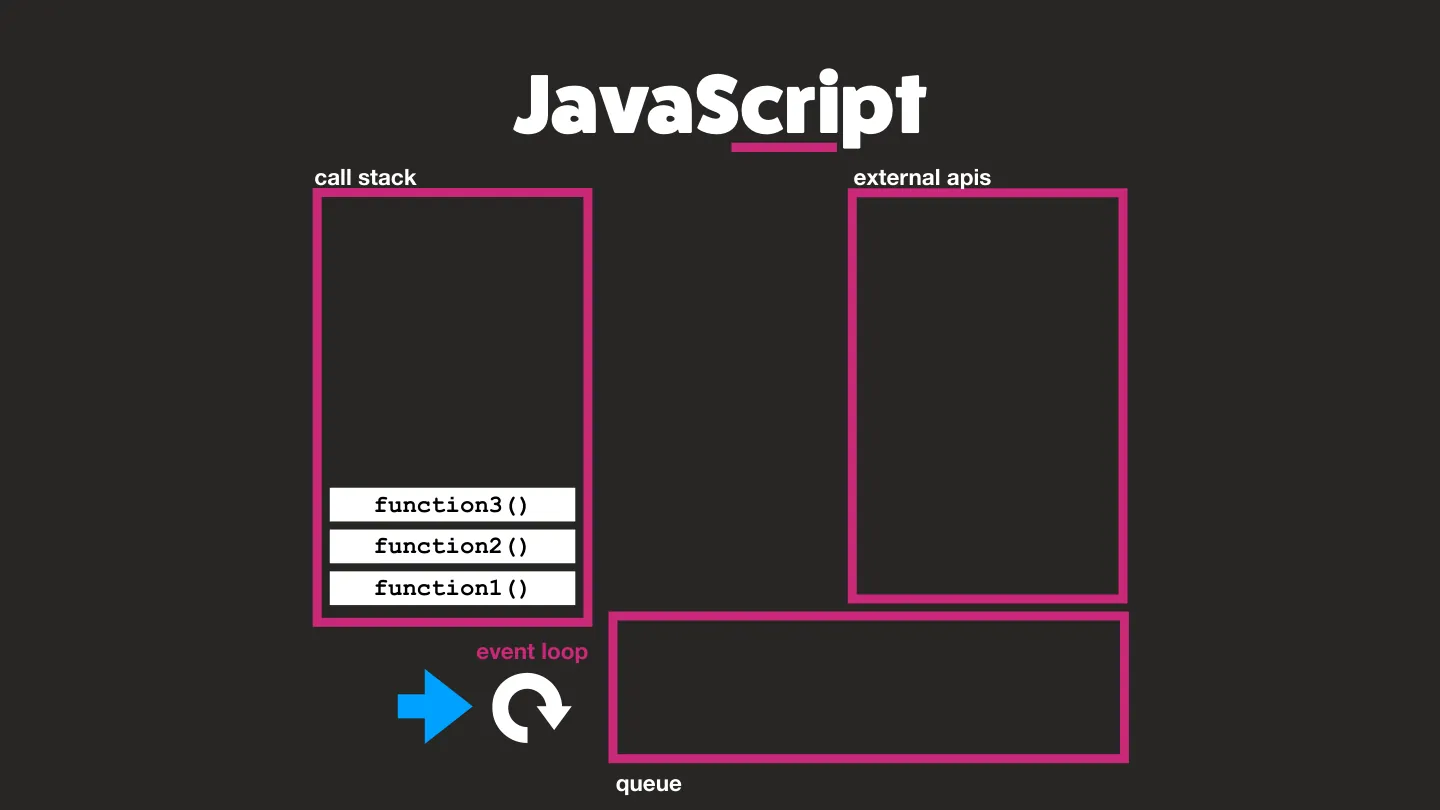
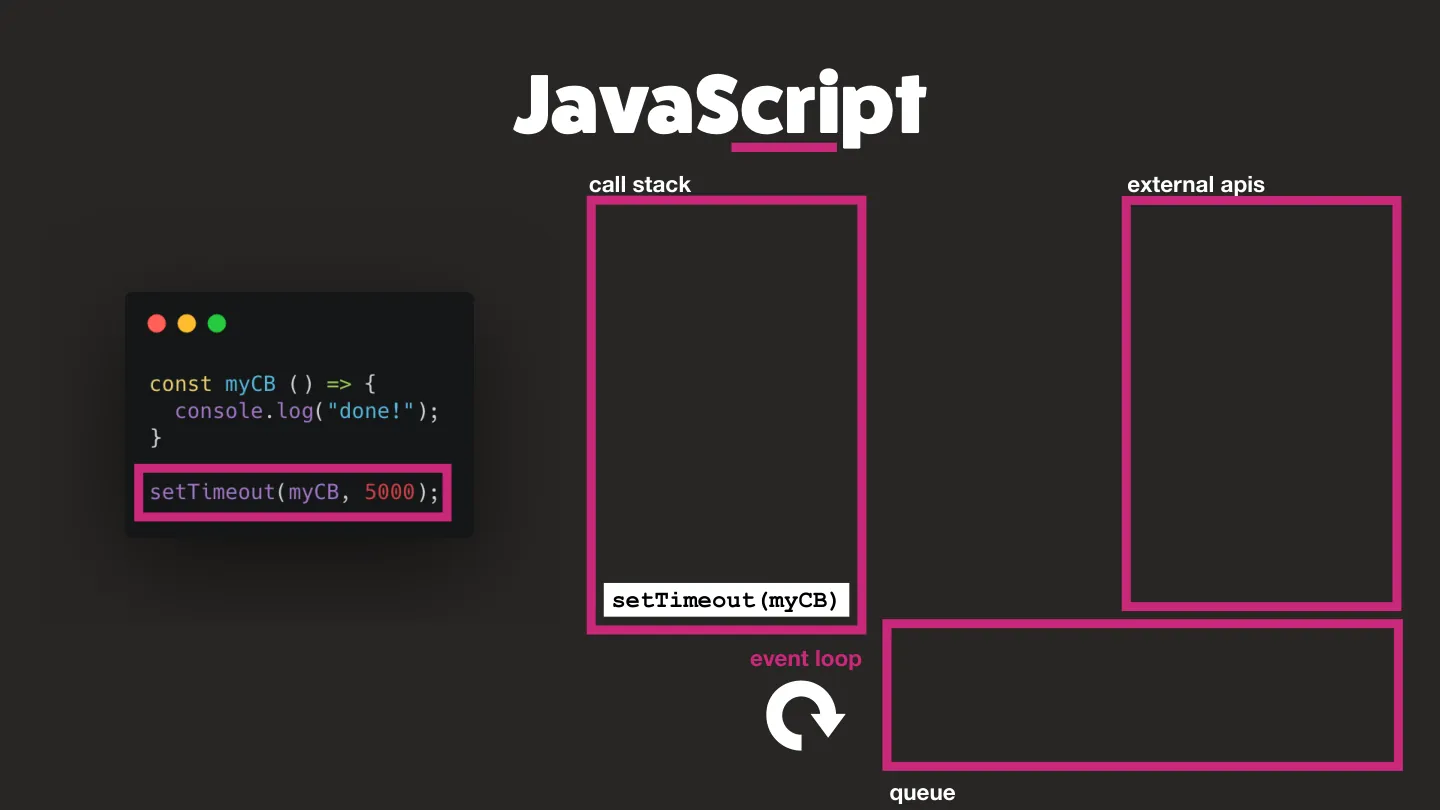
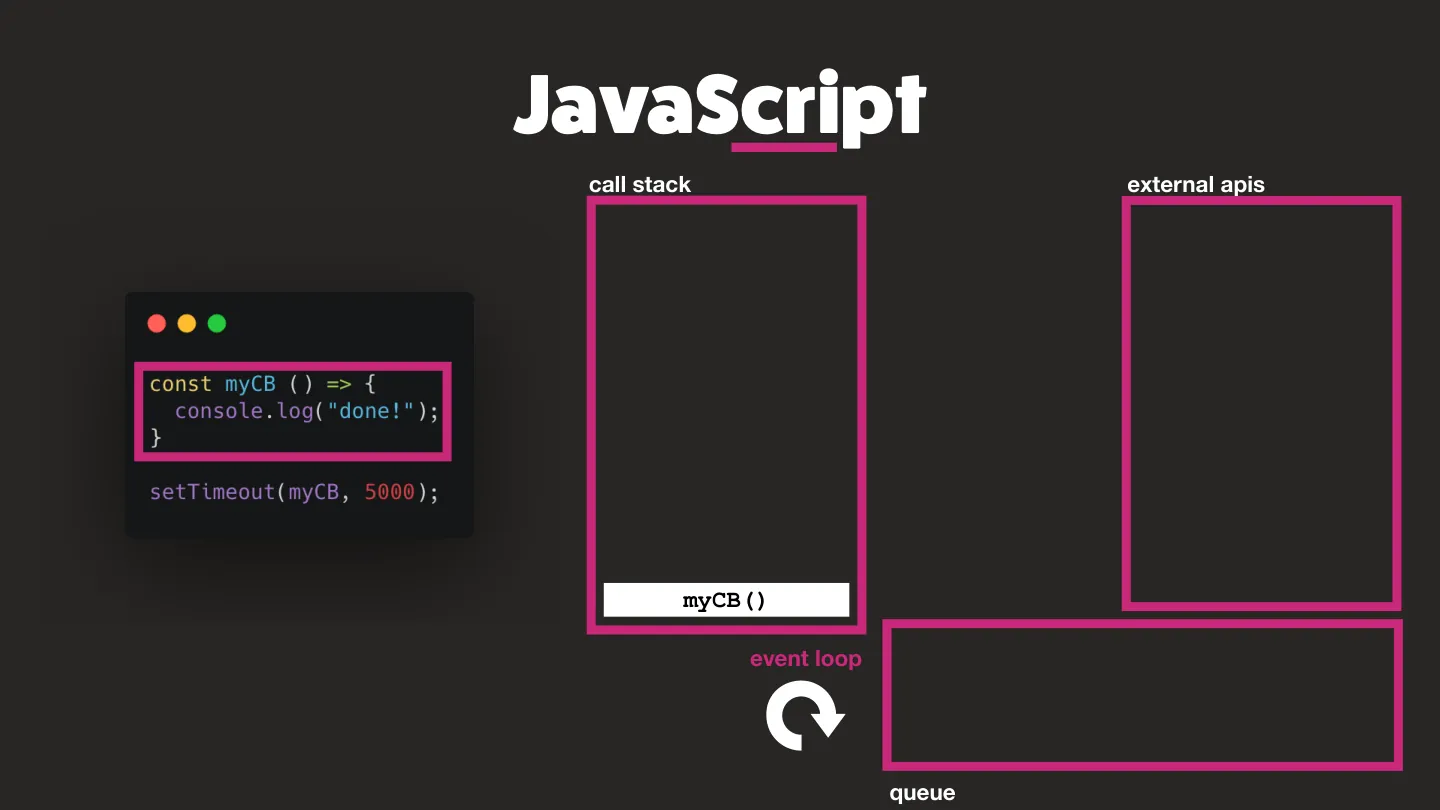
- The call stack is that single thread. Calls push a frame on, returns pop it off, last in, first out, until the stack is empty.
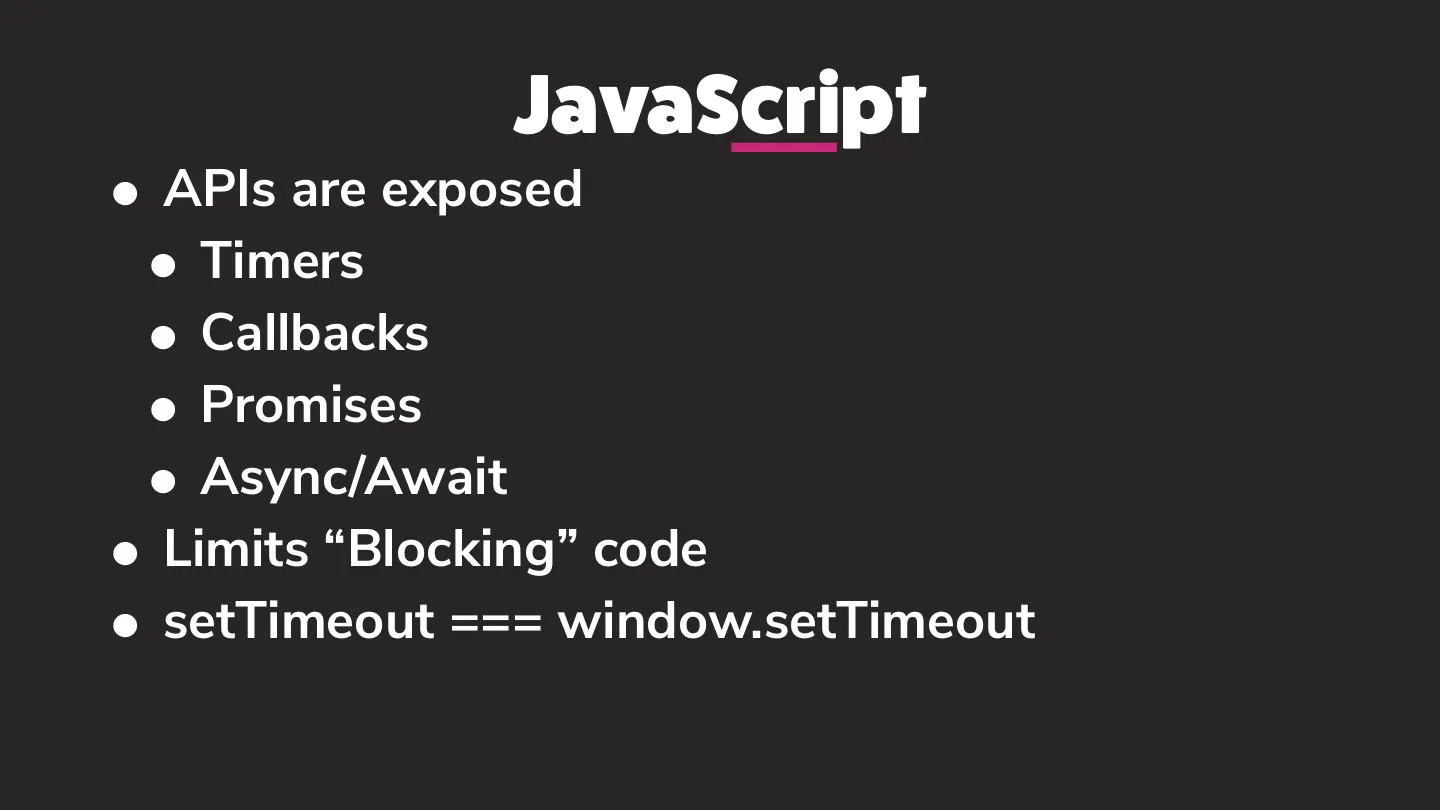
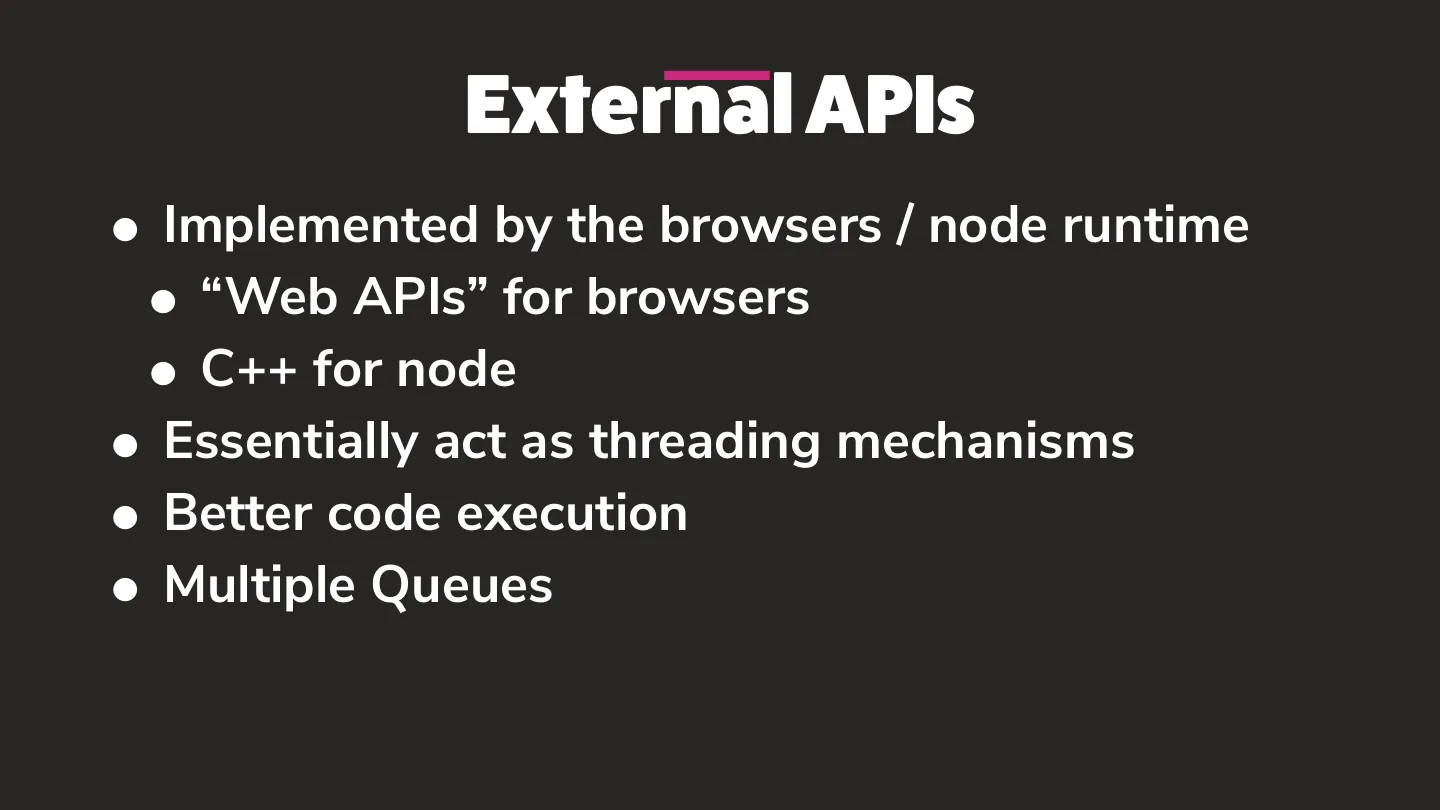
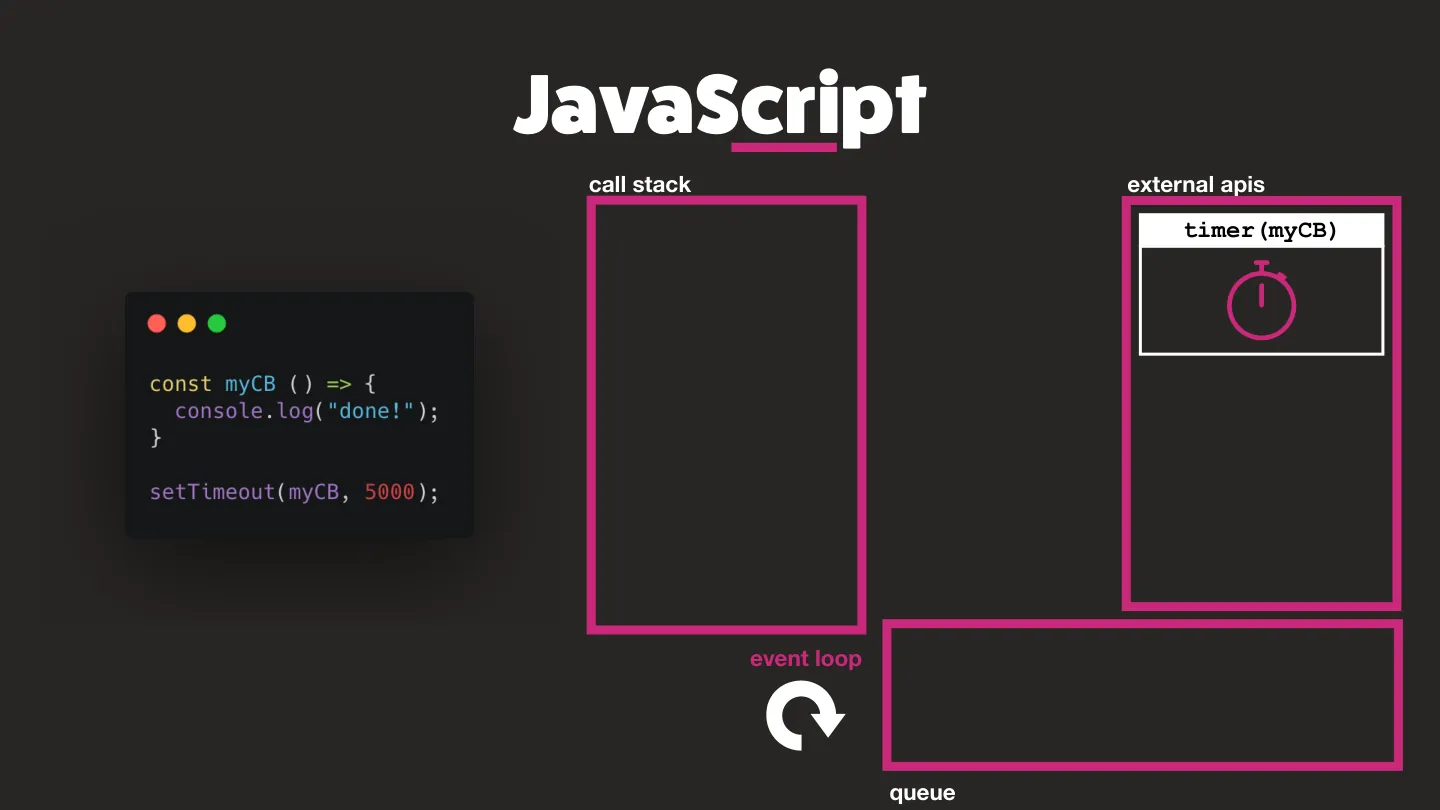
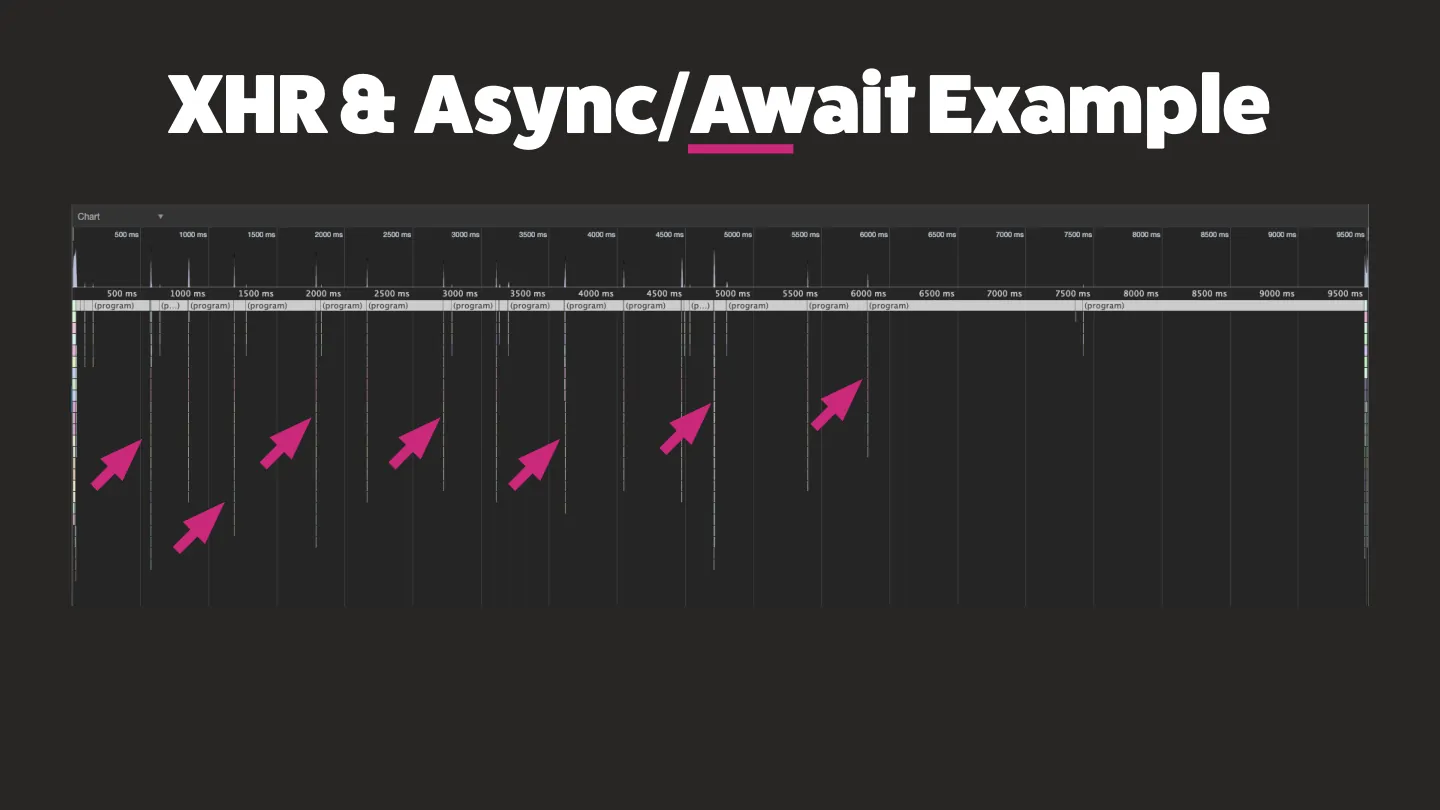
- Timers, callbacks, promises and async/await hand work to external APIs (Web APIs in the browser, C++ in Node). When it’s done, the callback waits in a queue, and the event loop moves it onto the call stack once the stack is empty.
Profiling it
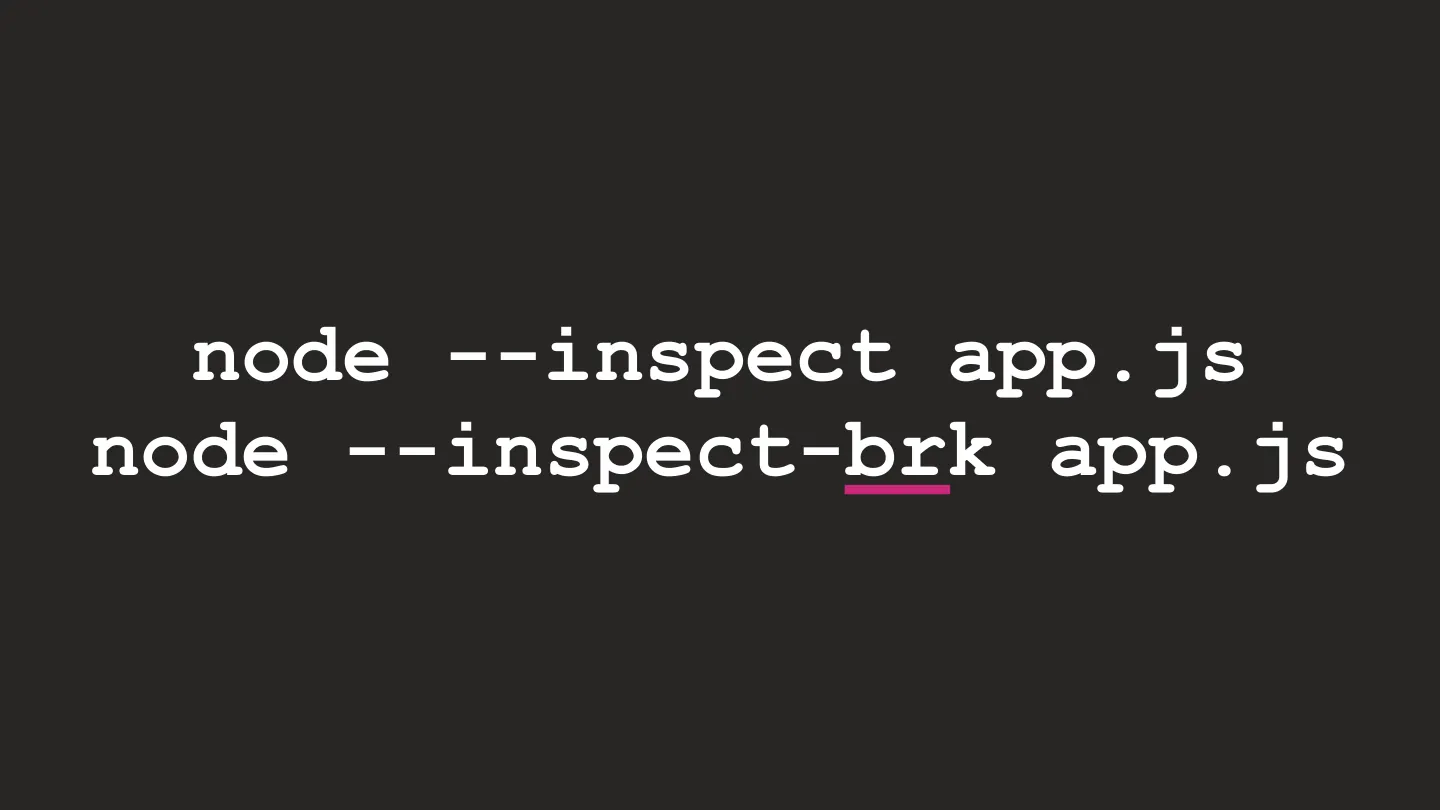
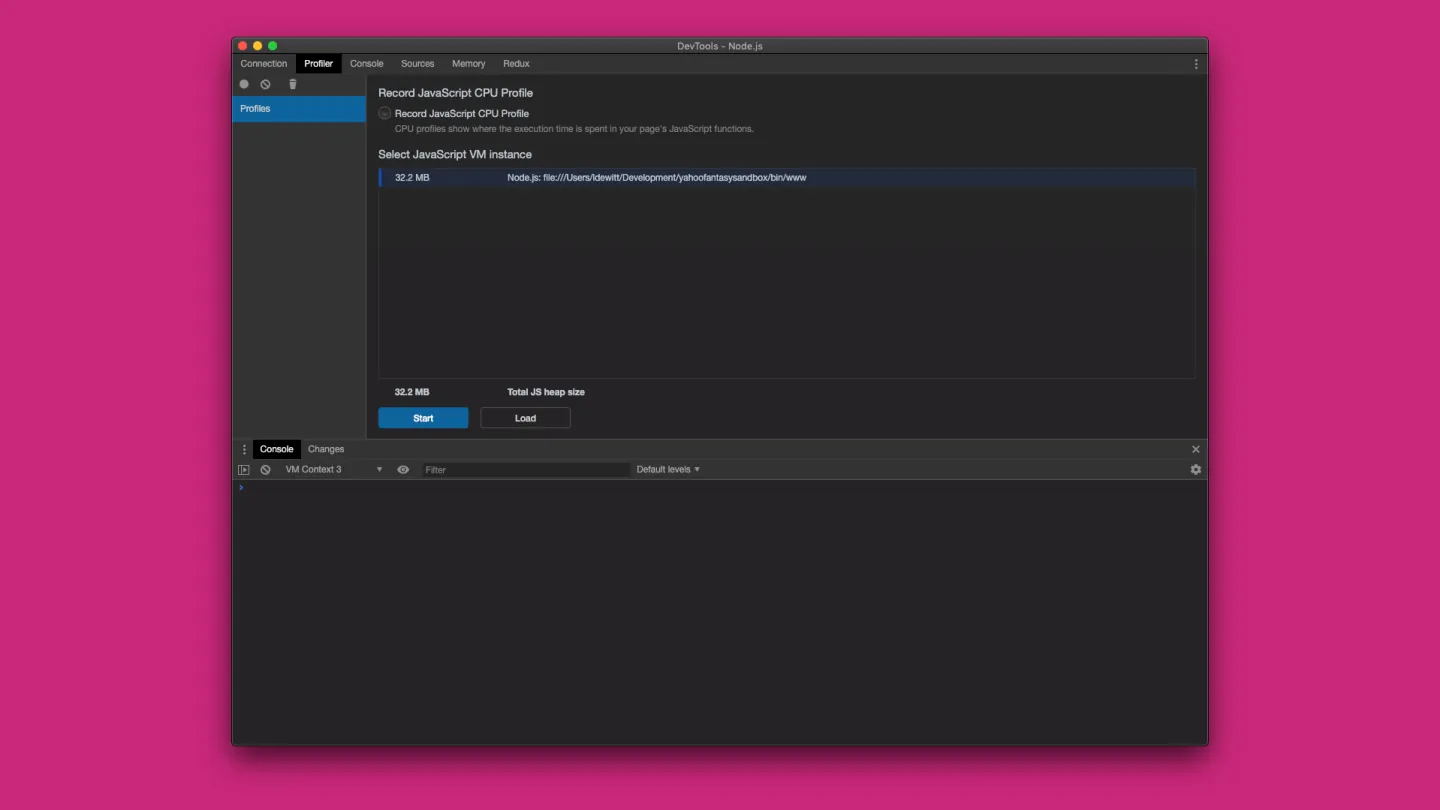
- In Node, start your app with
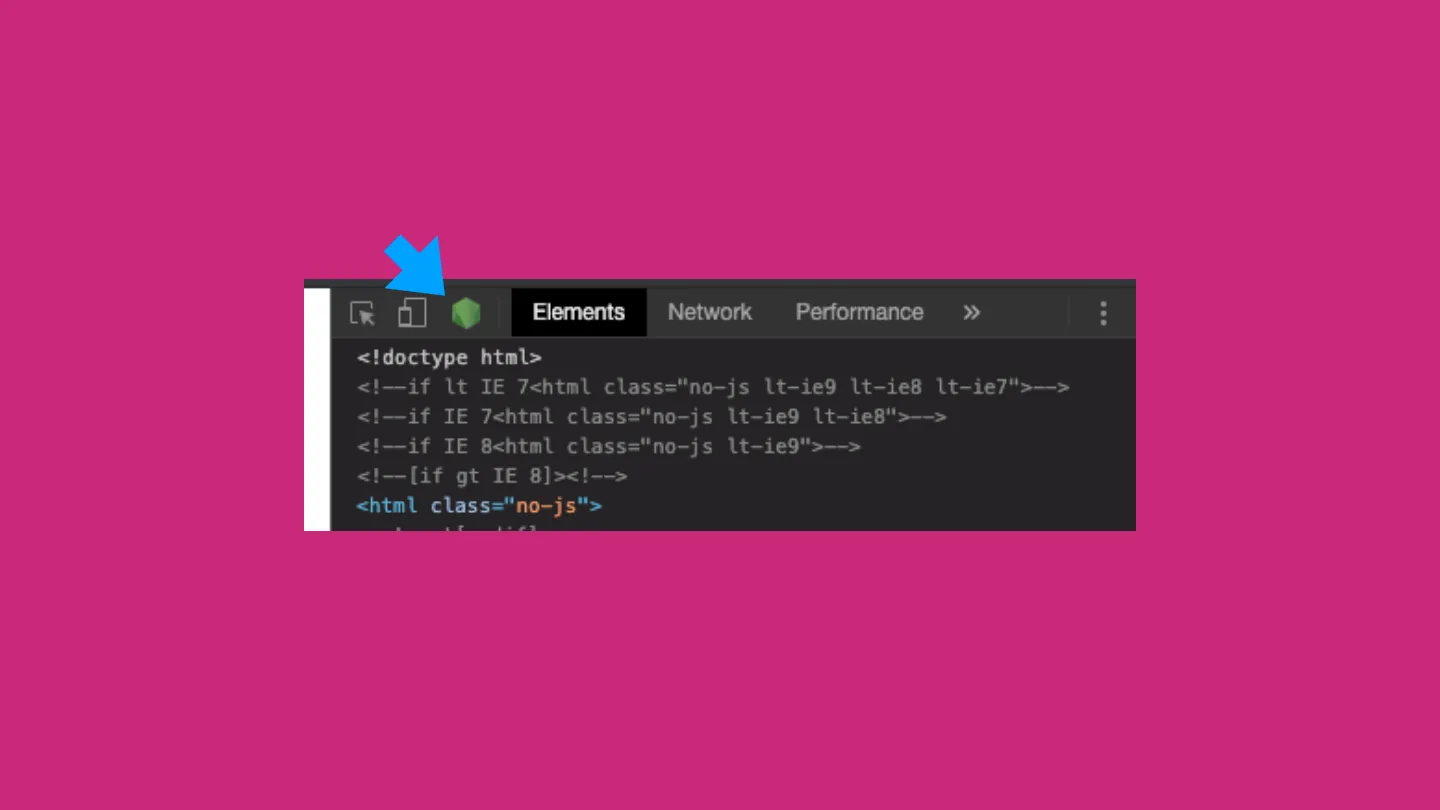
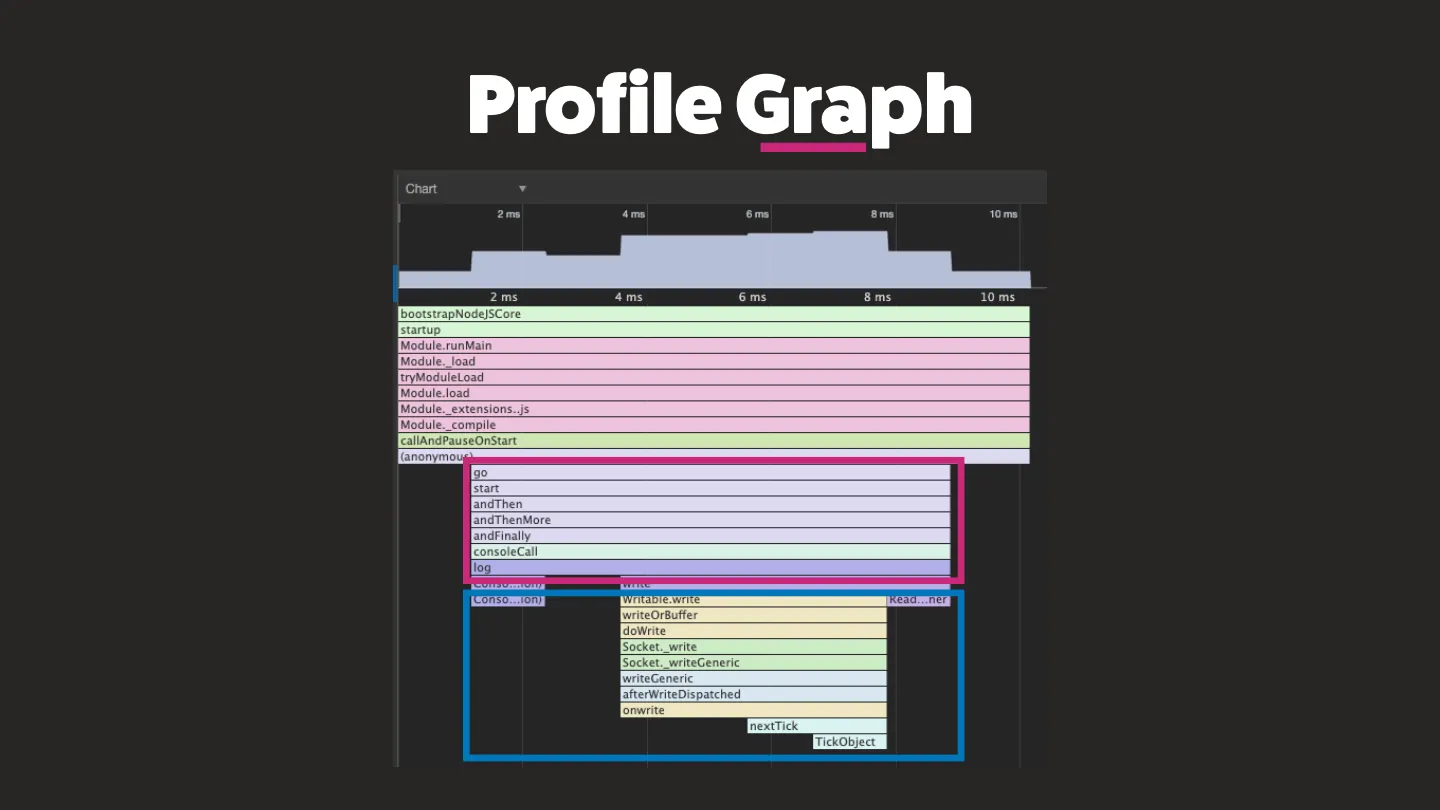
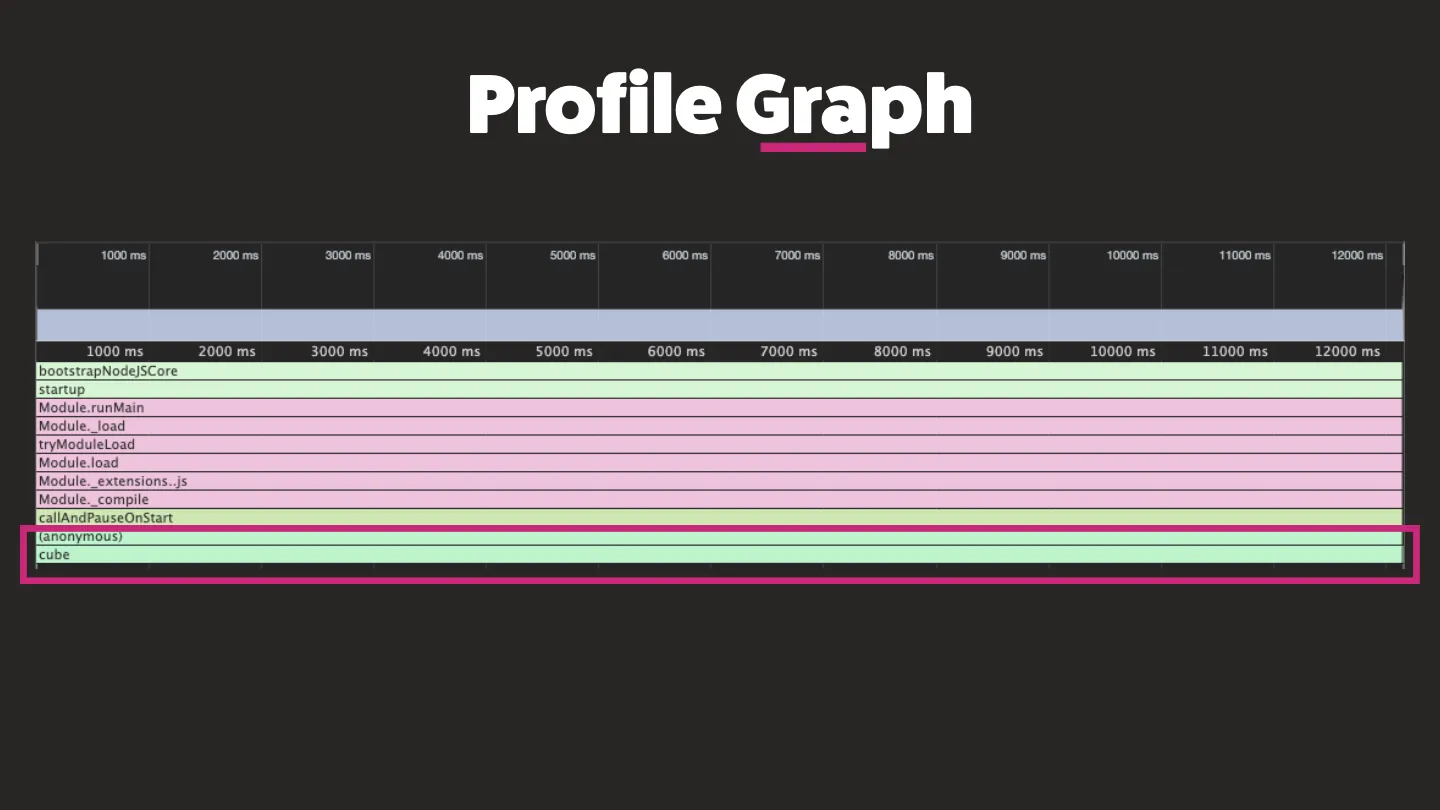
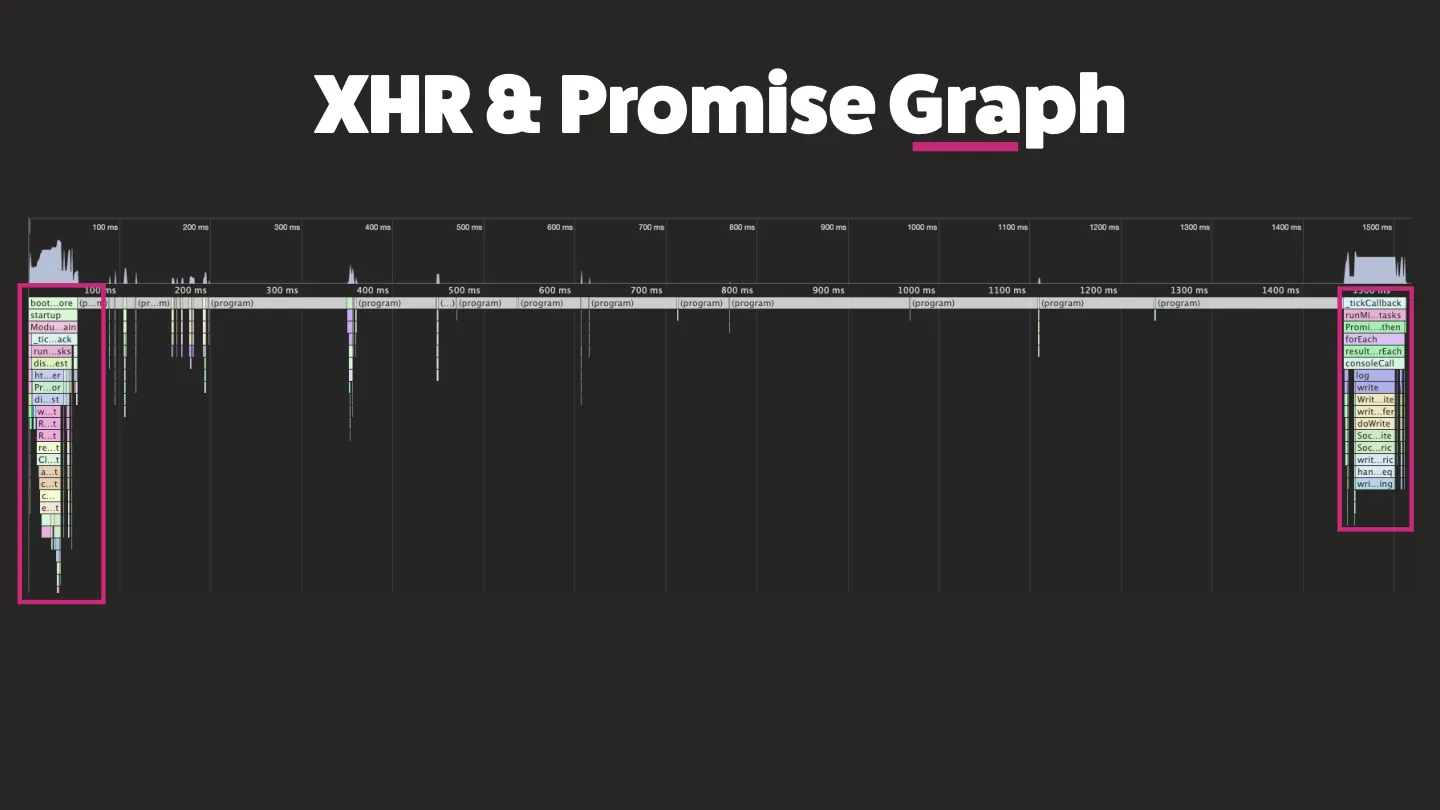
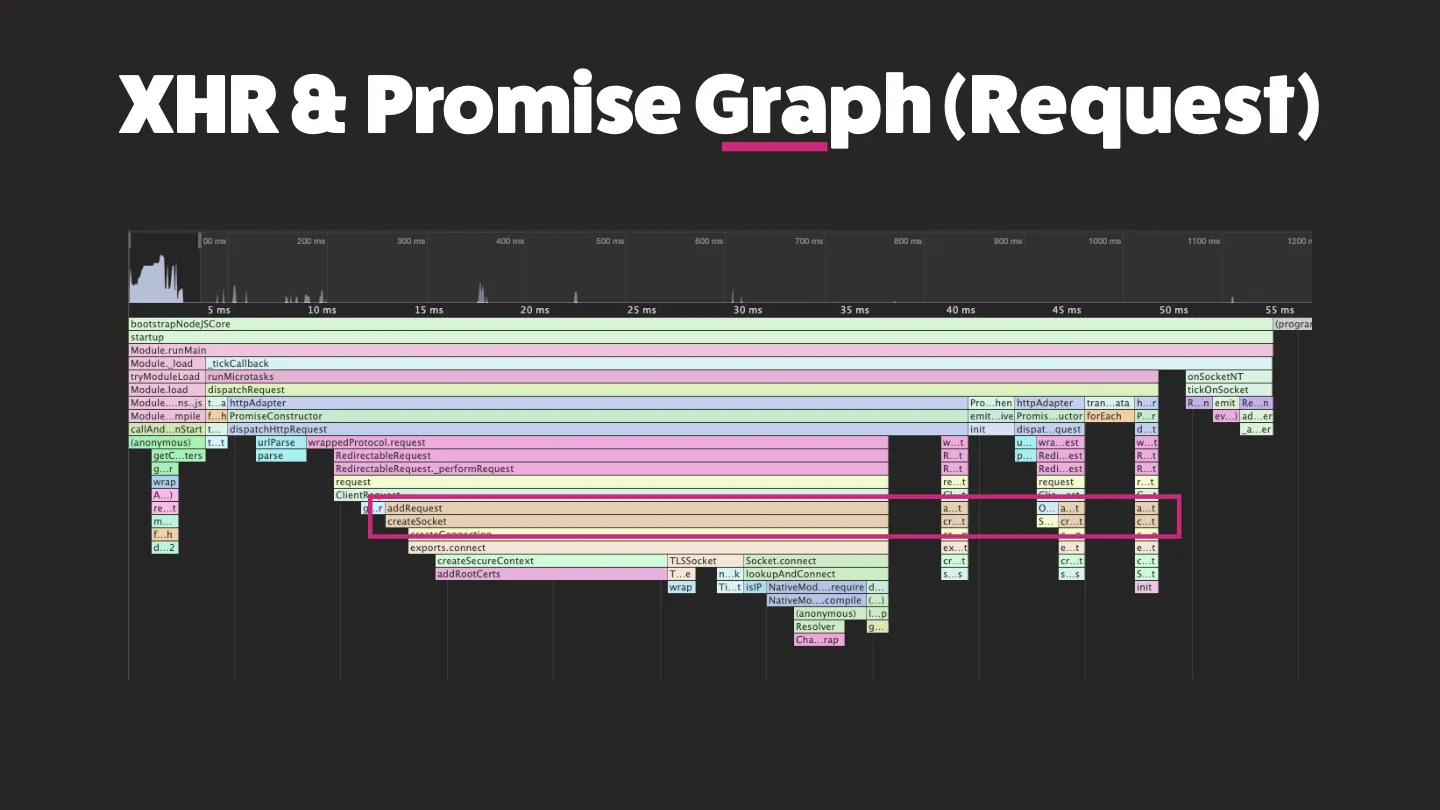
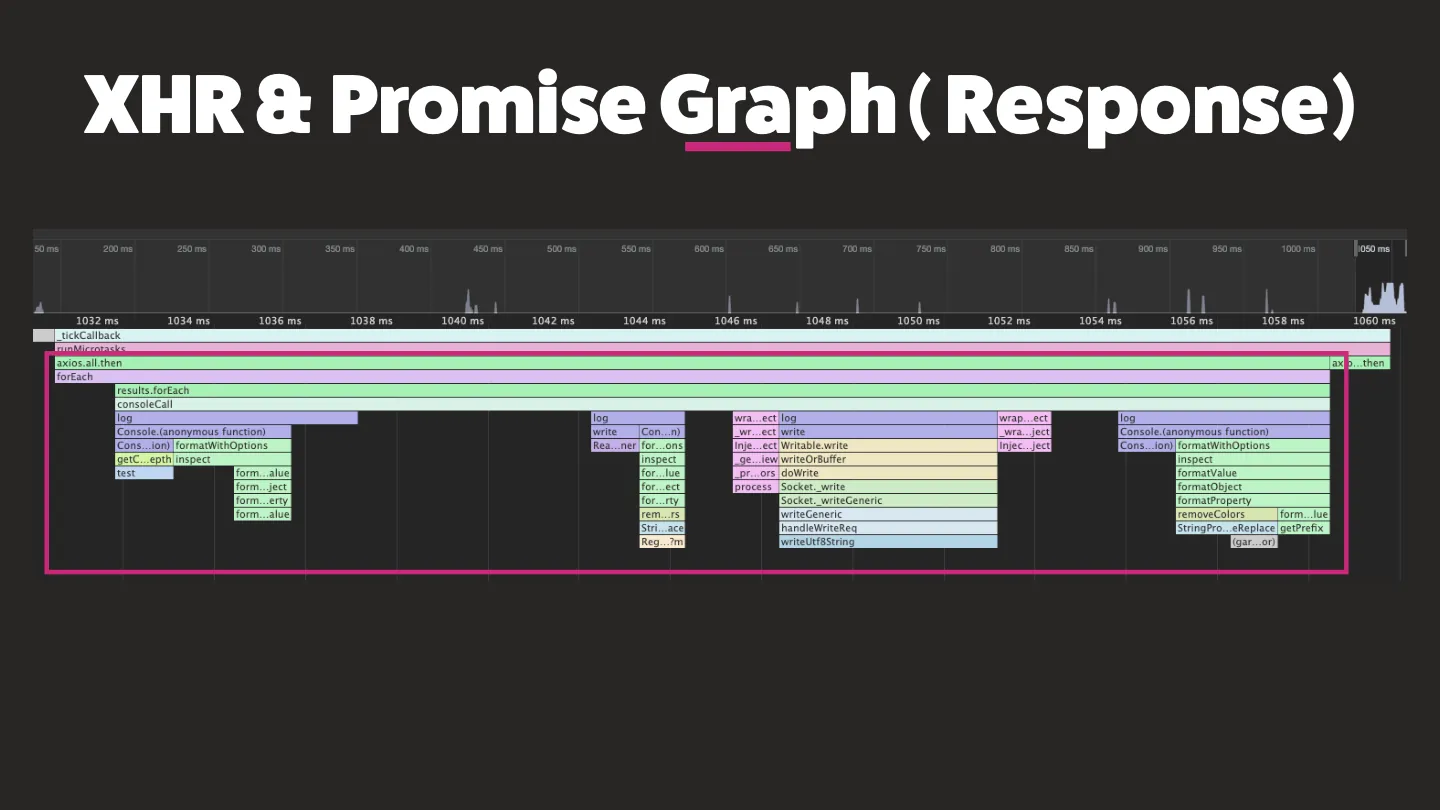
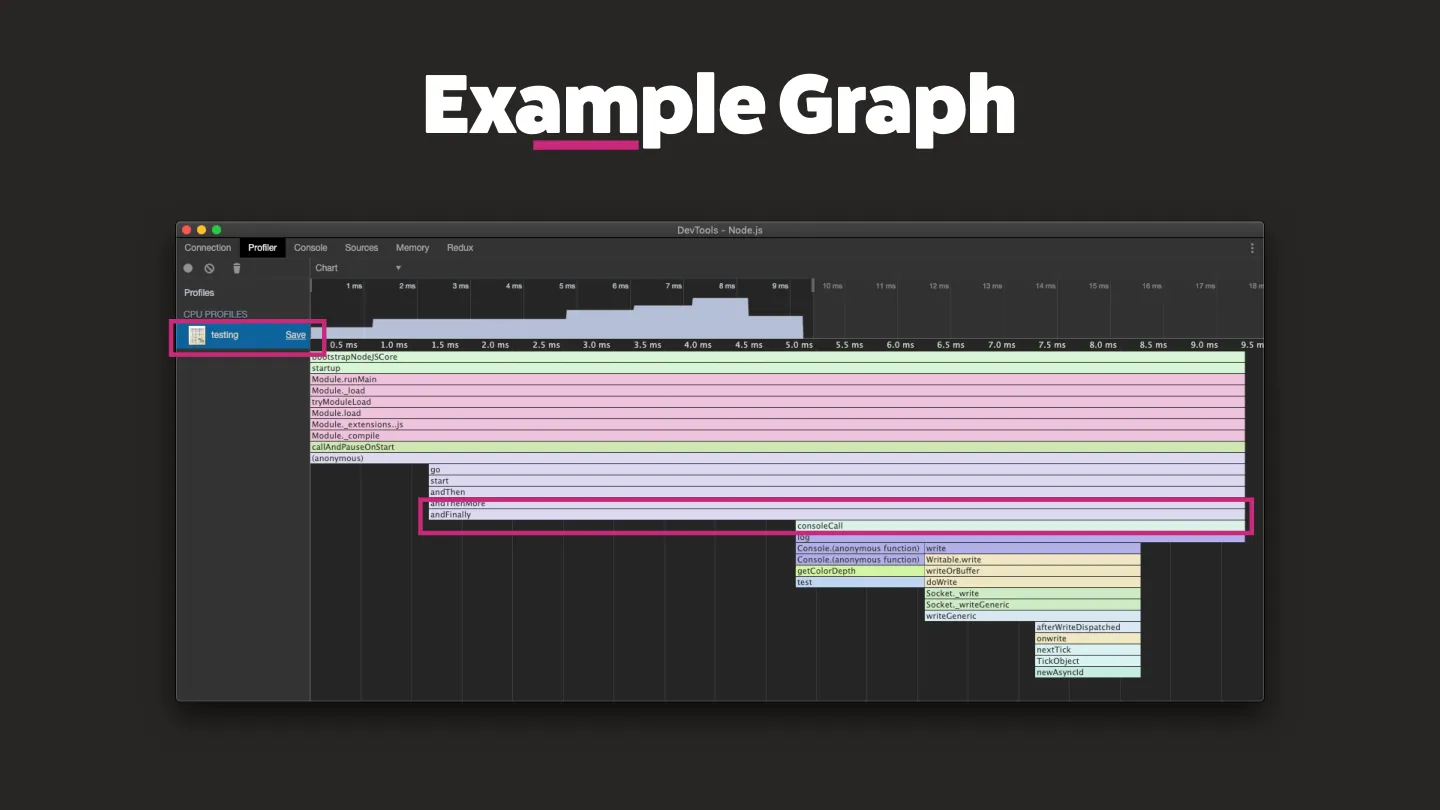
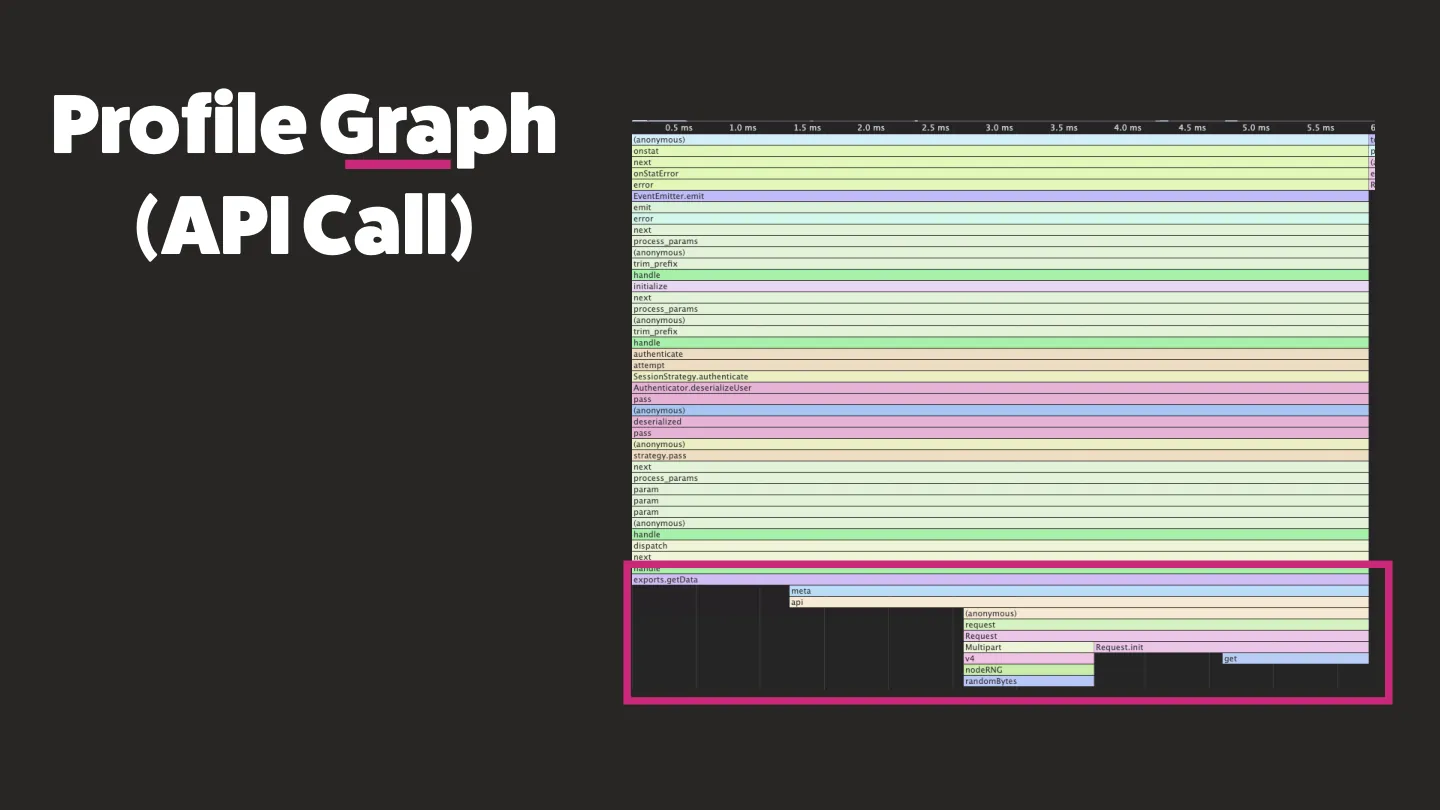
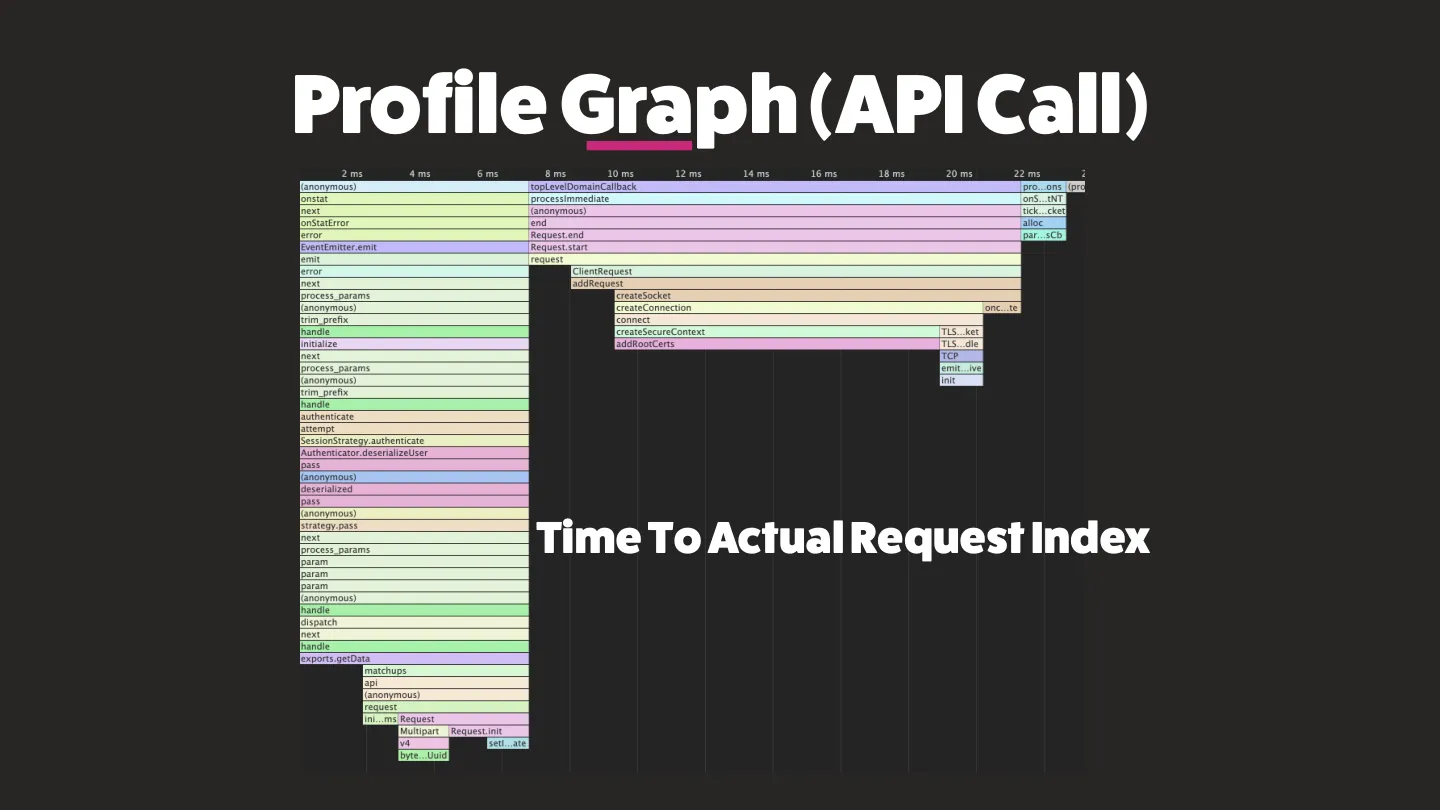
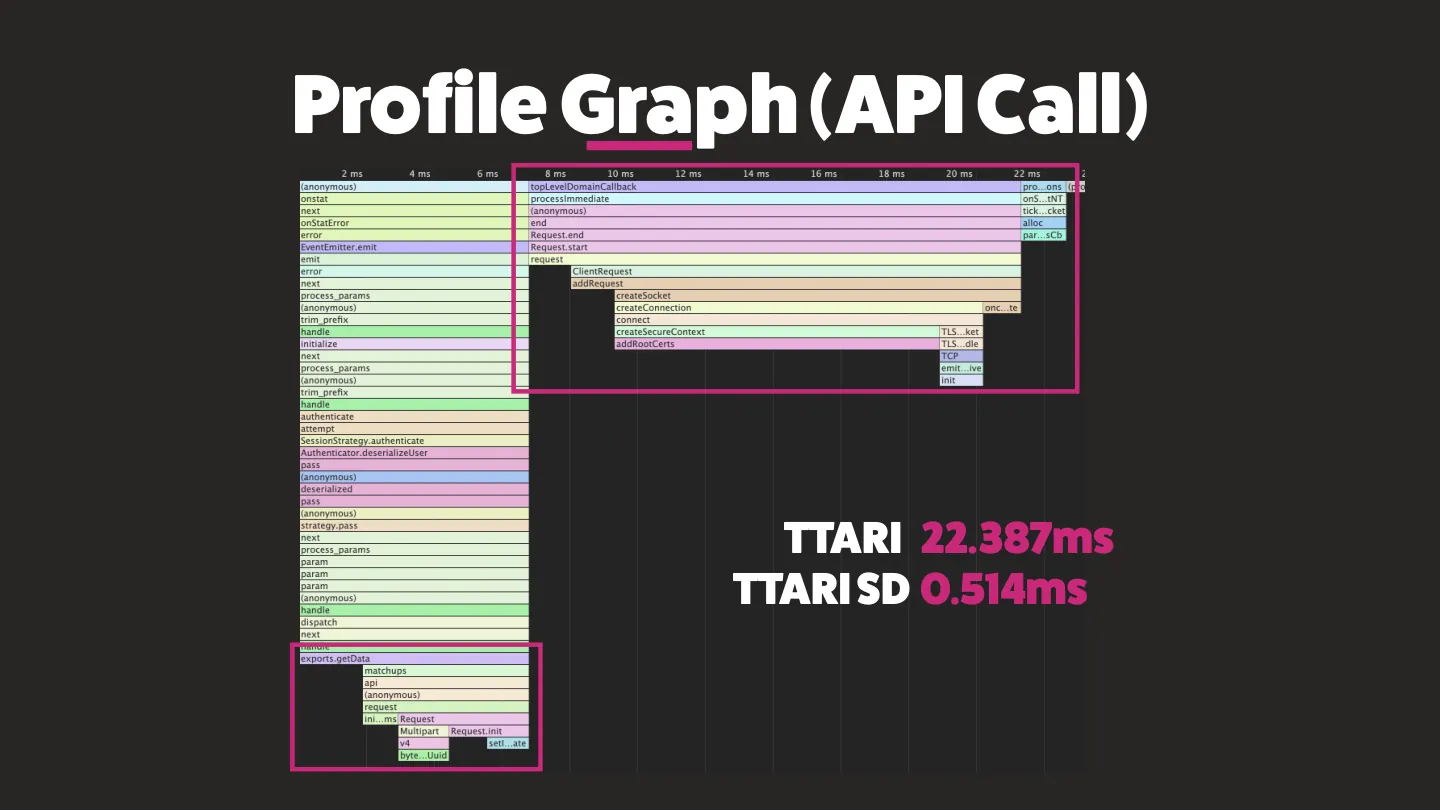
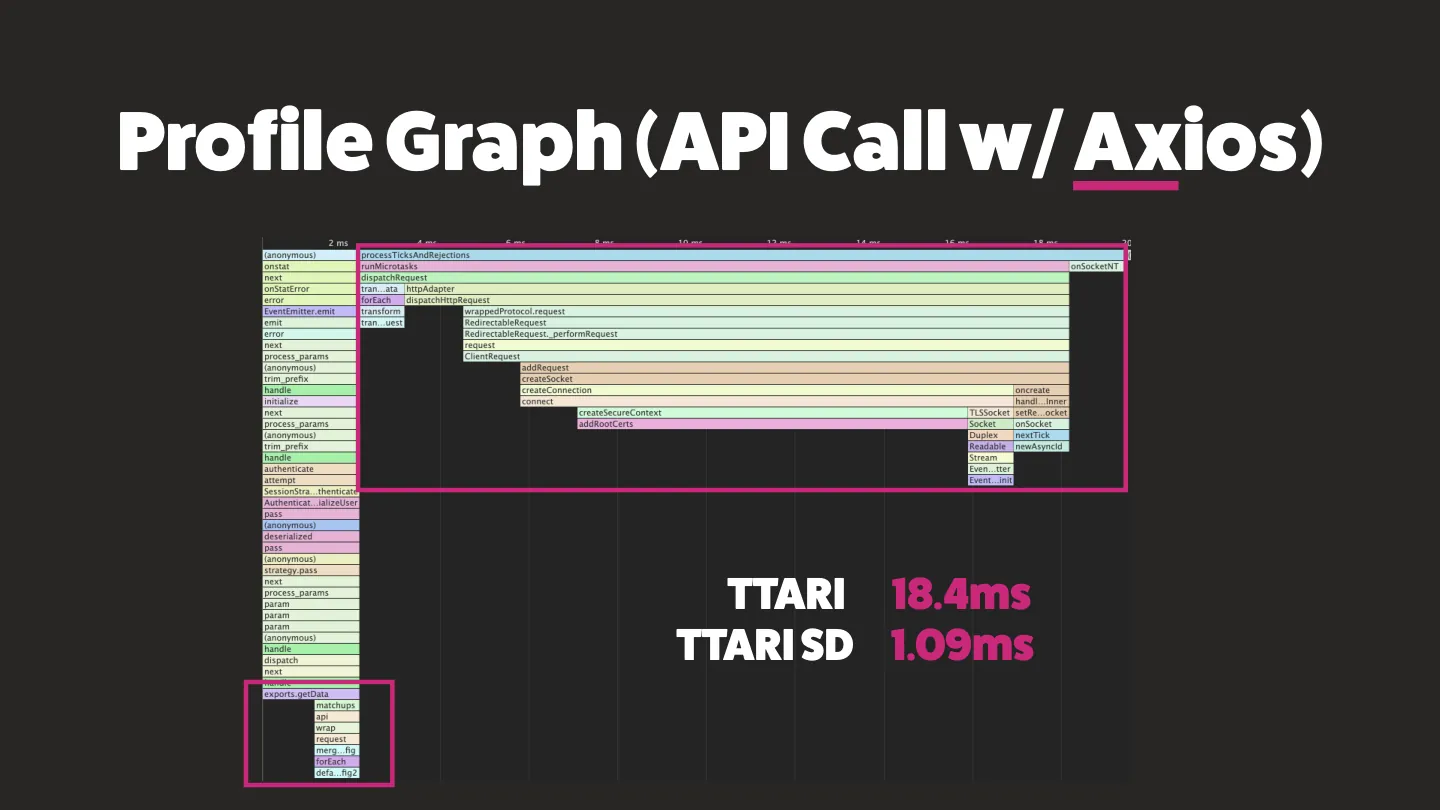
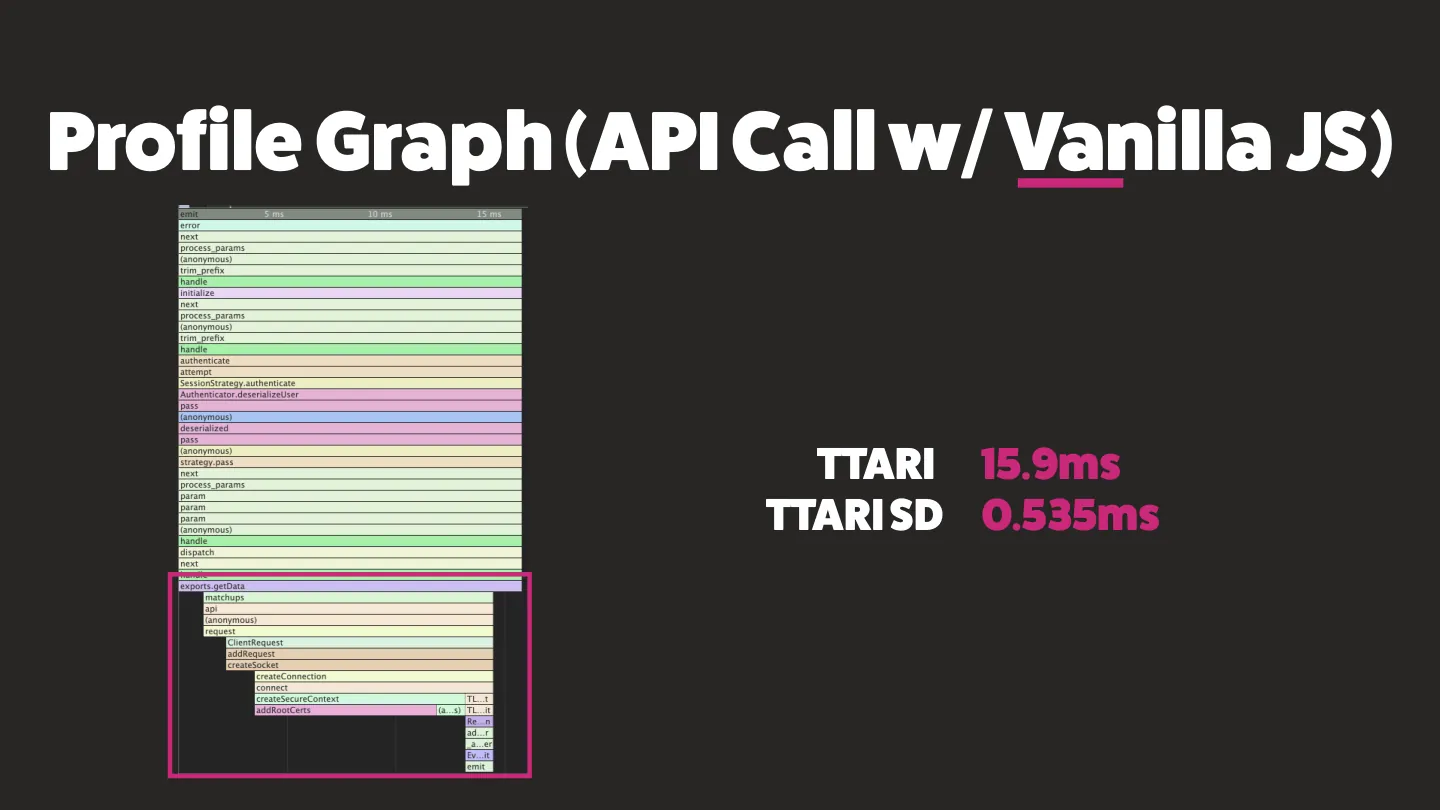
node --inspect app.js(or--inspect-brkto pause on the first line) and attach Chrome DevTools. - The profile graph shows the call stack over time, so you can see what ran, for how long, and what called it.
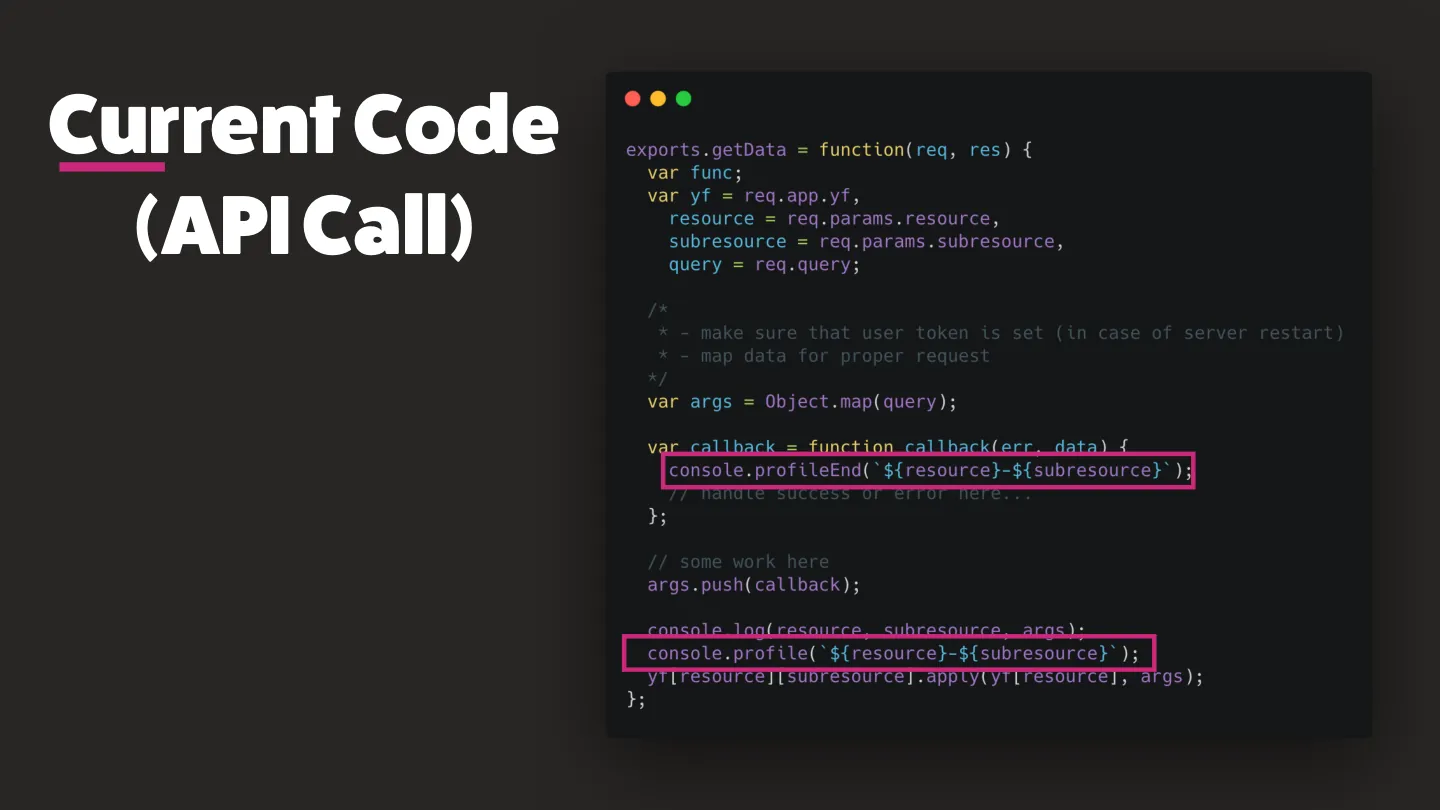
- Wrap the code you care about in
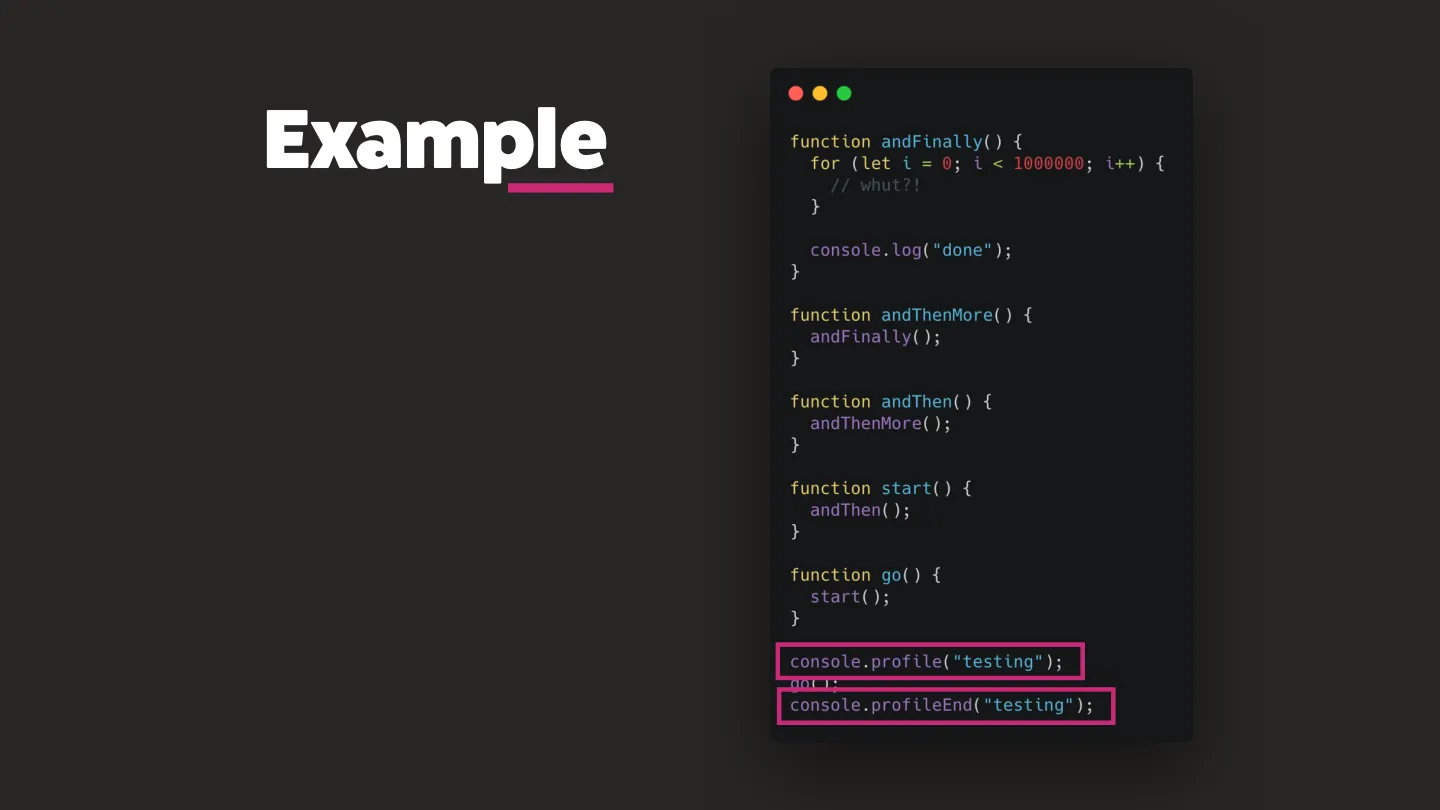
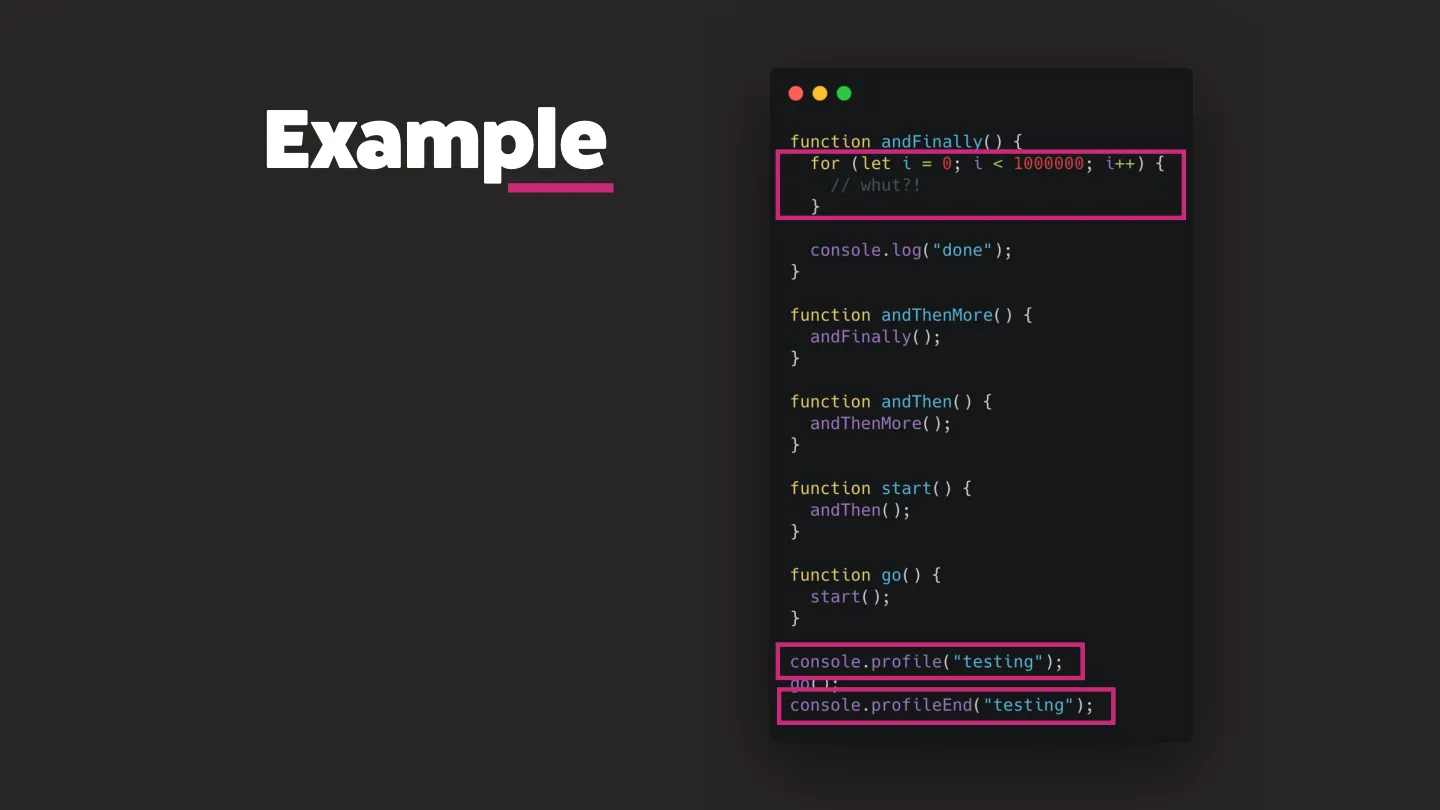
console.profile()andconsole.profileEnd()to record just that part, instead of sprinklingconsole.logeverywhere.
Moment of truth
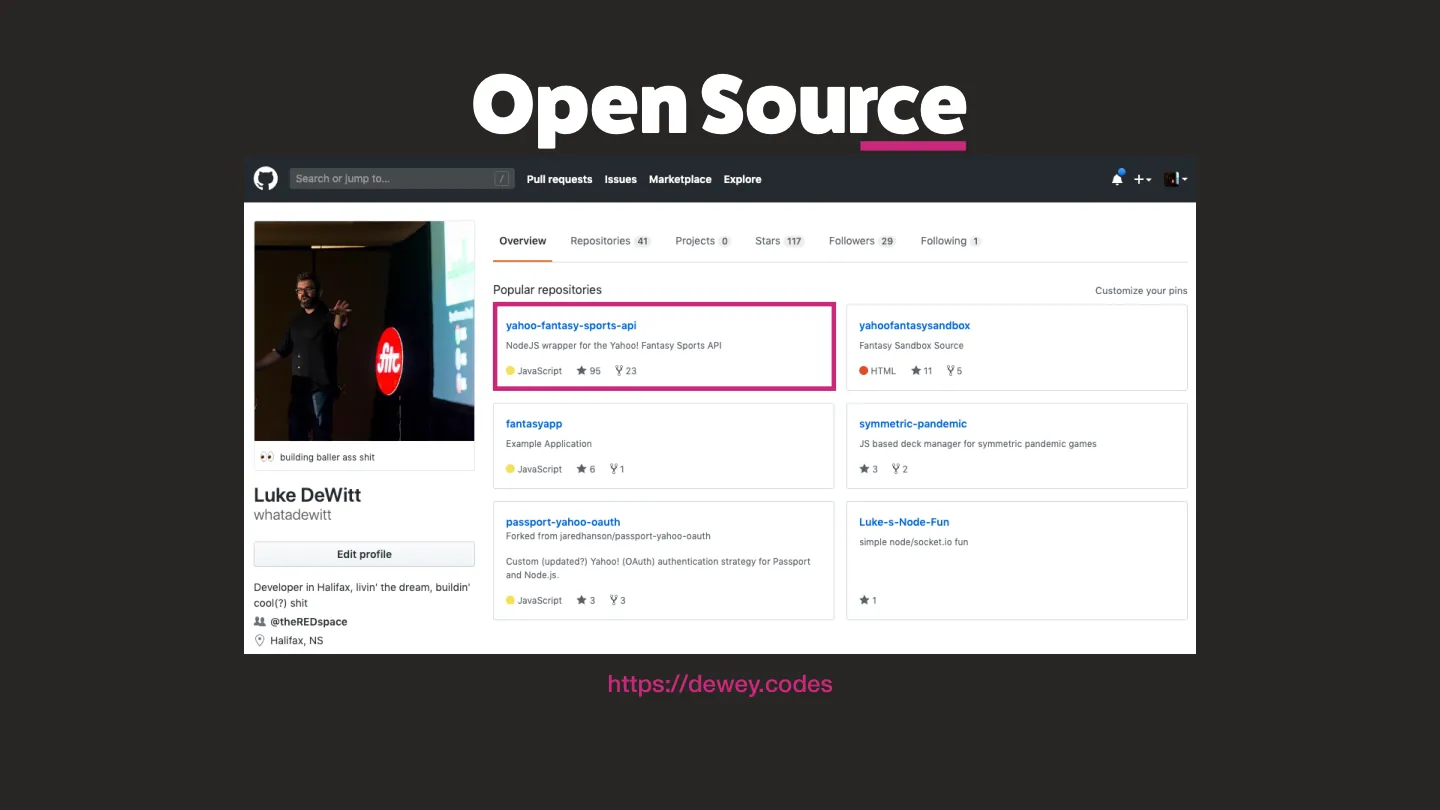
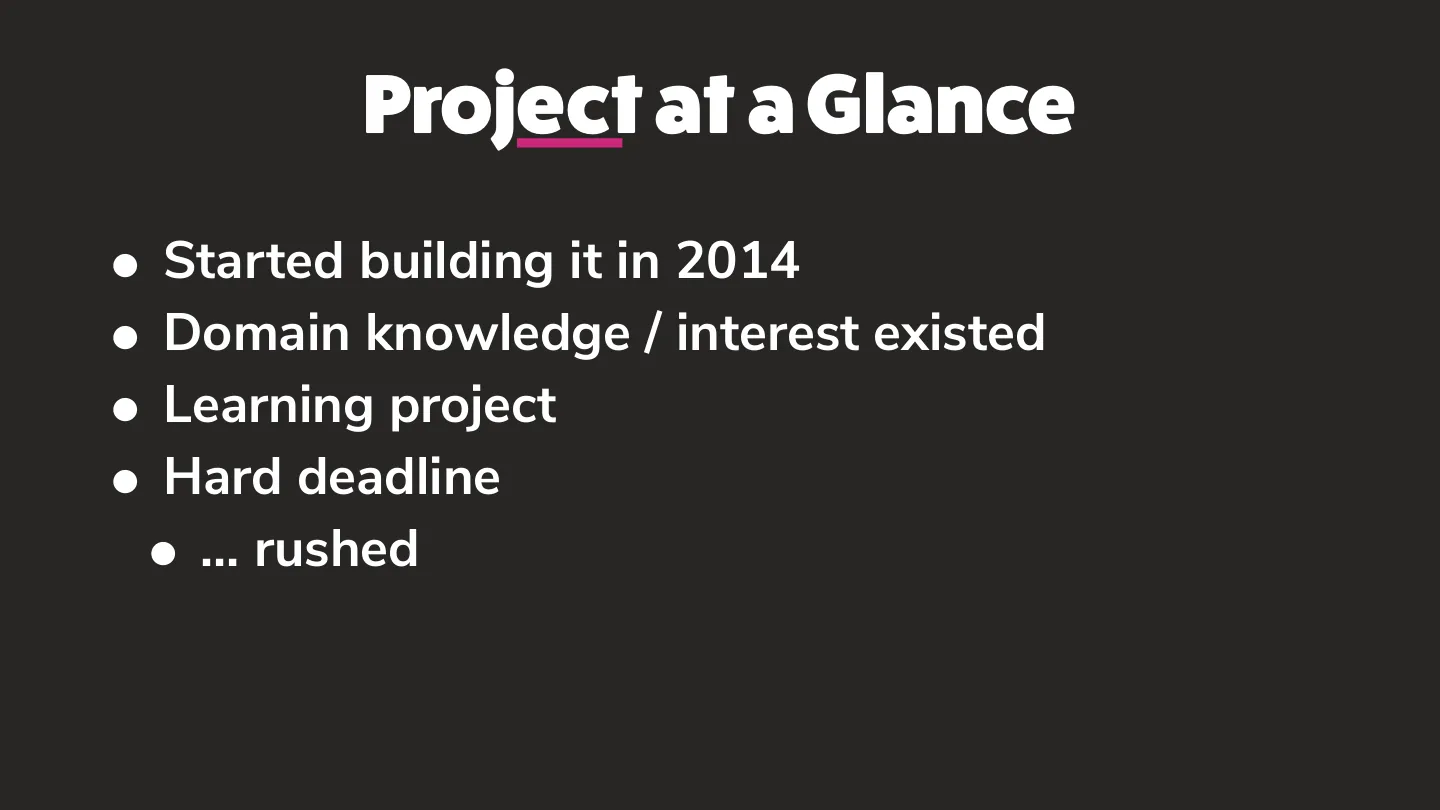
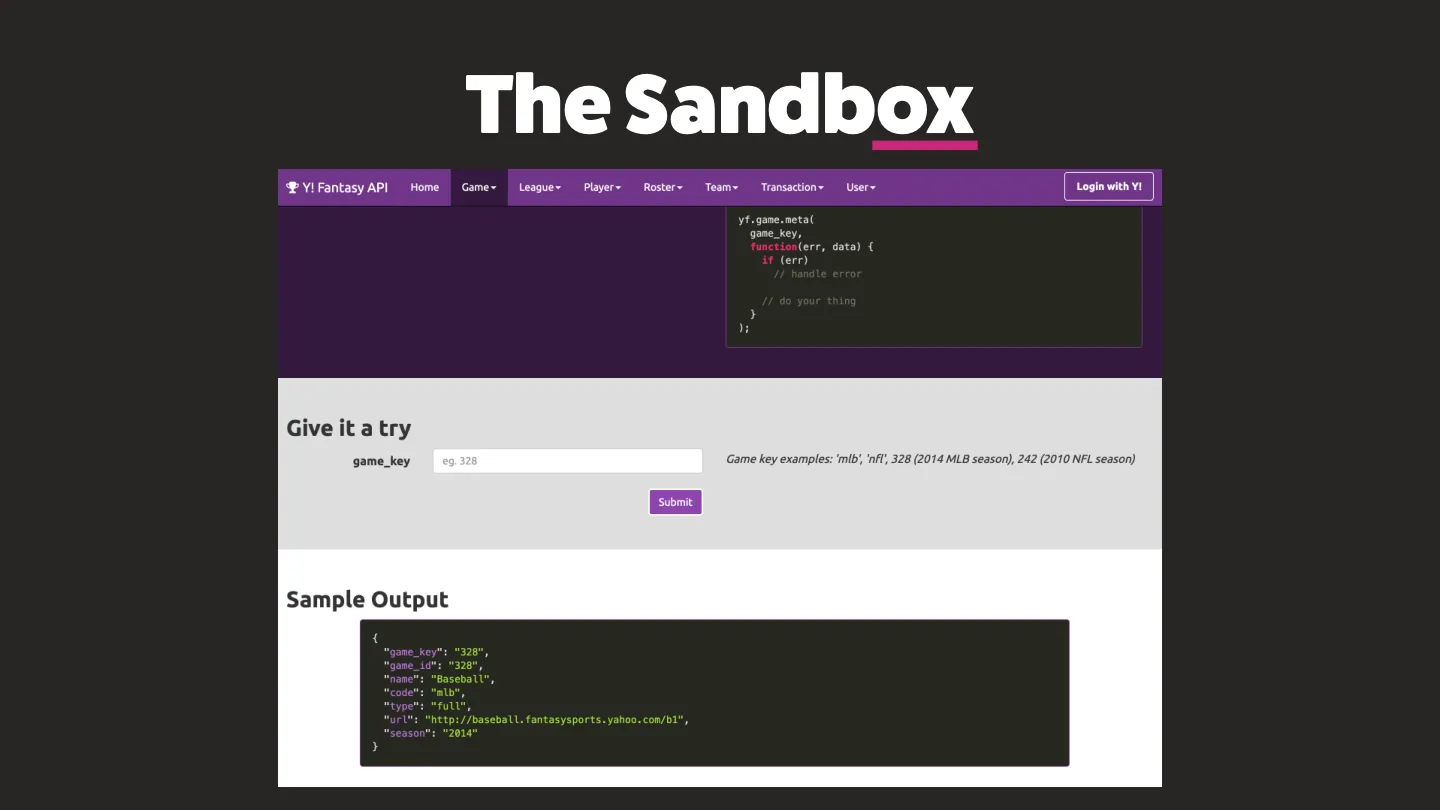
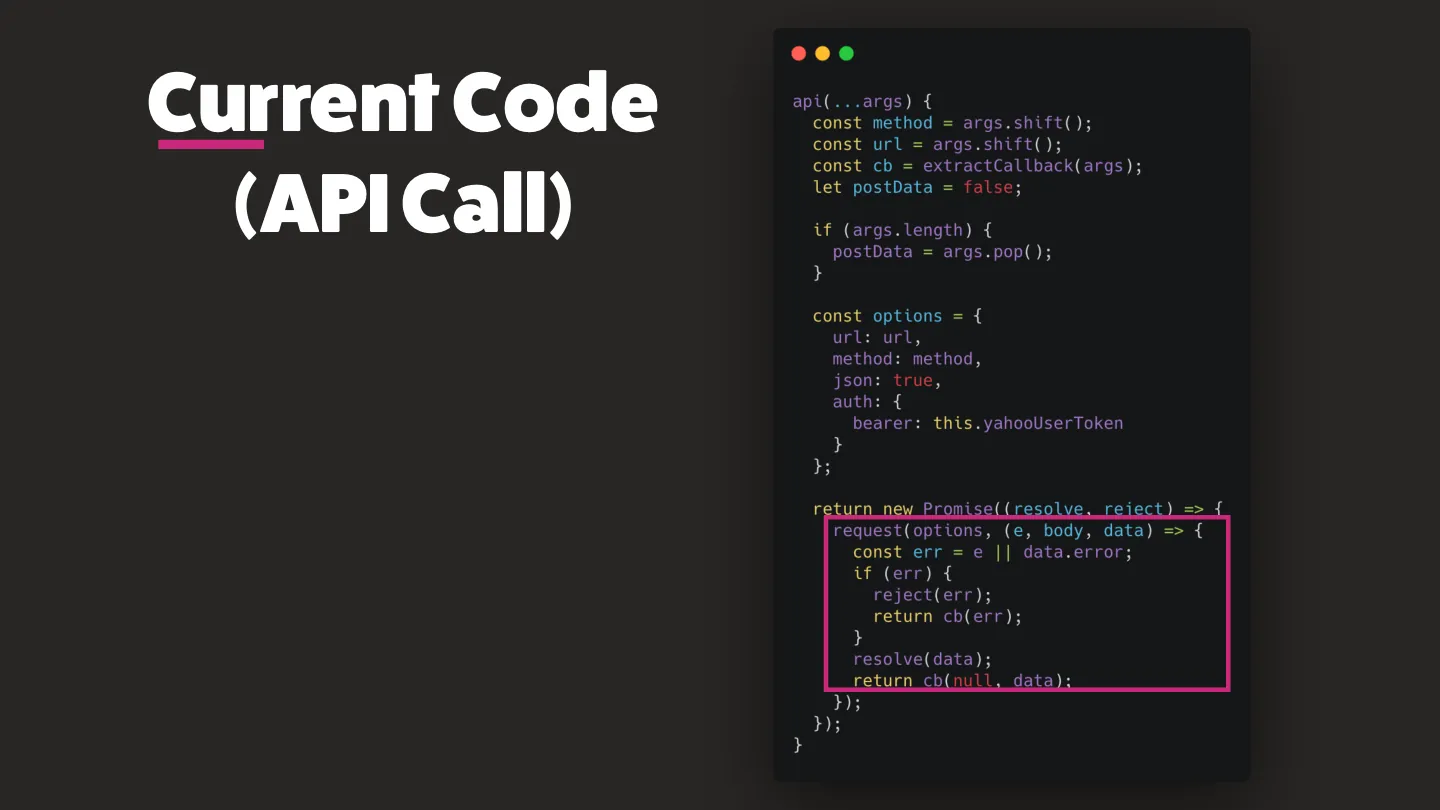
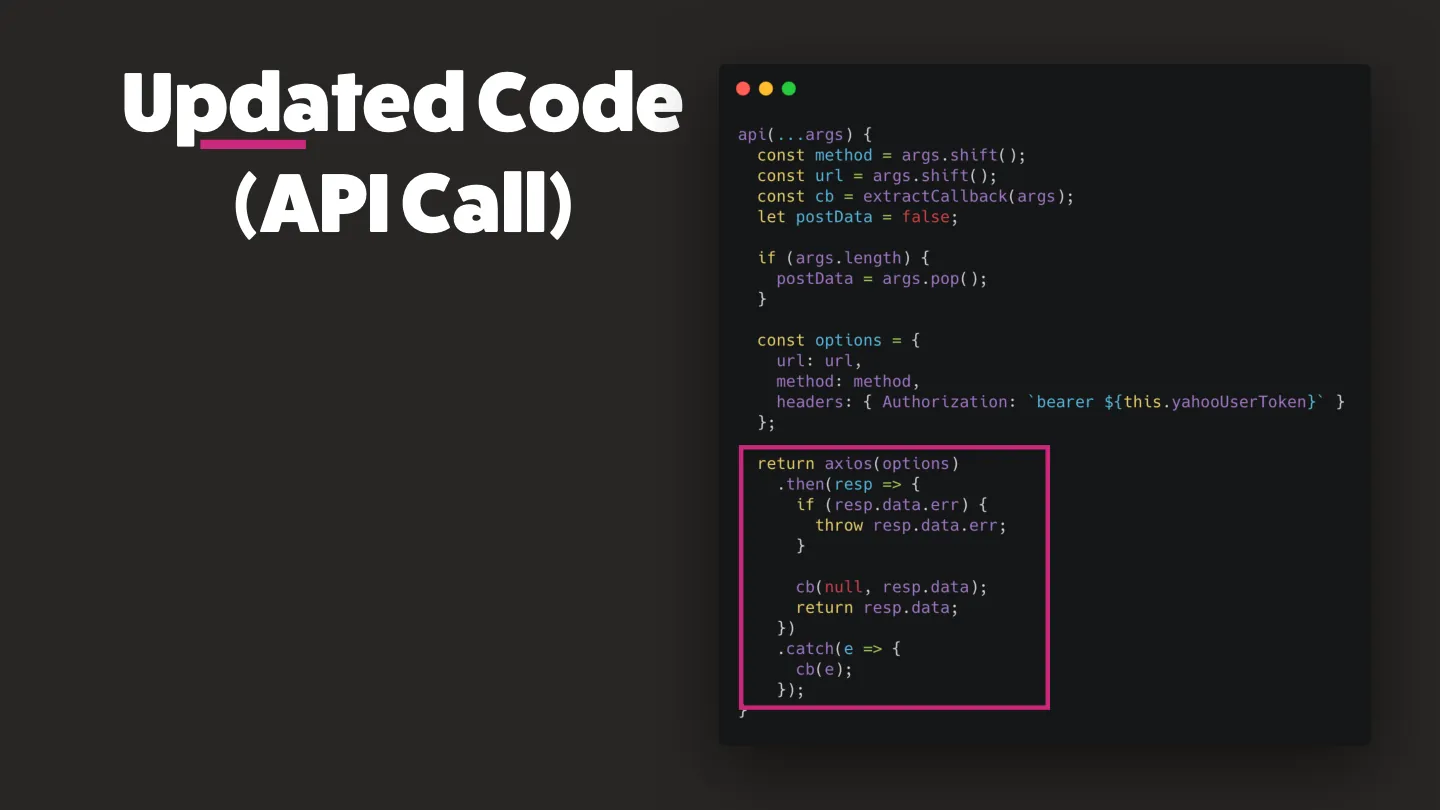
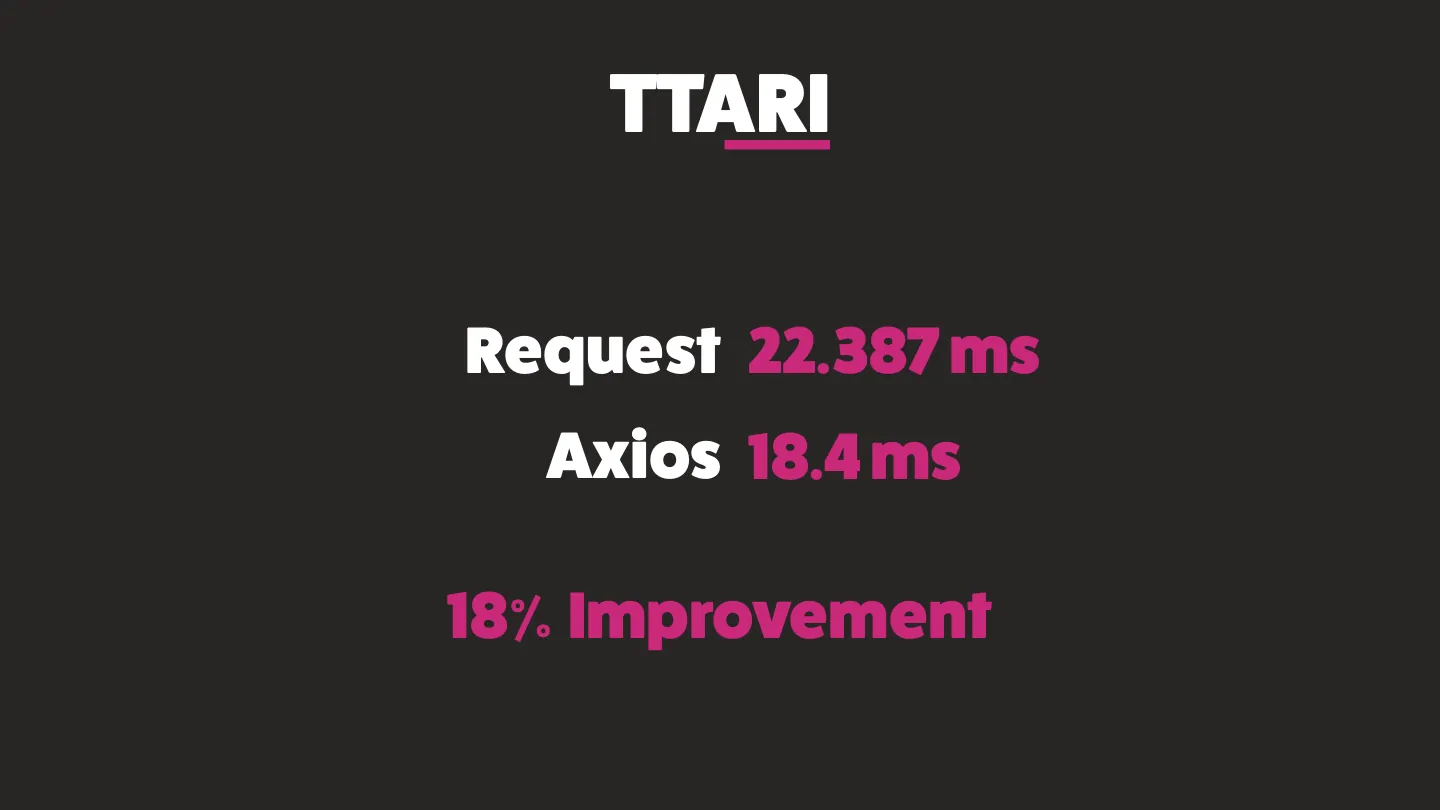
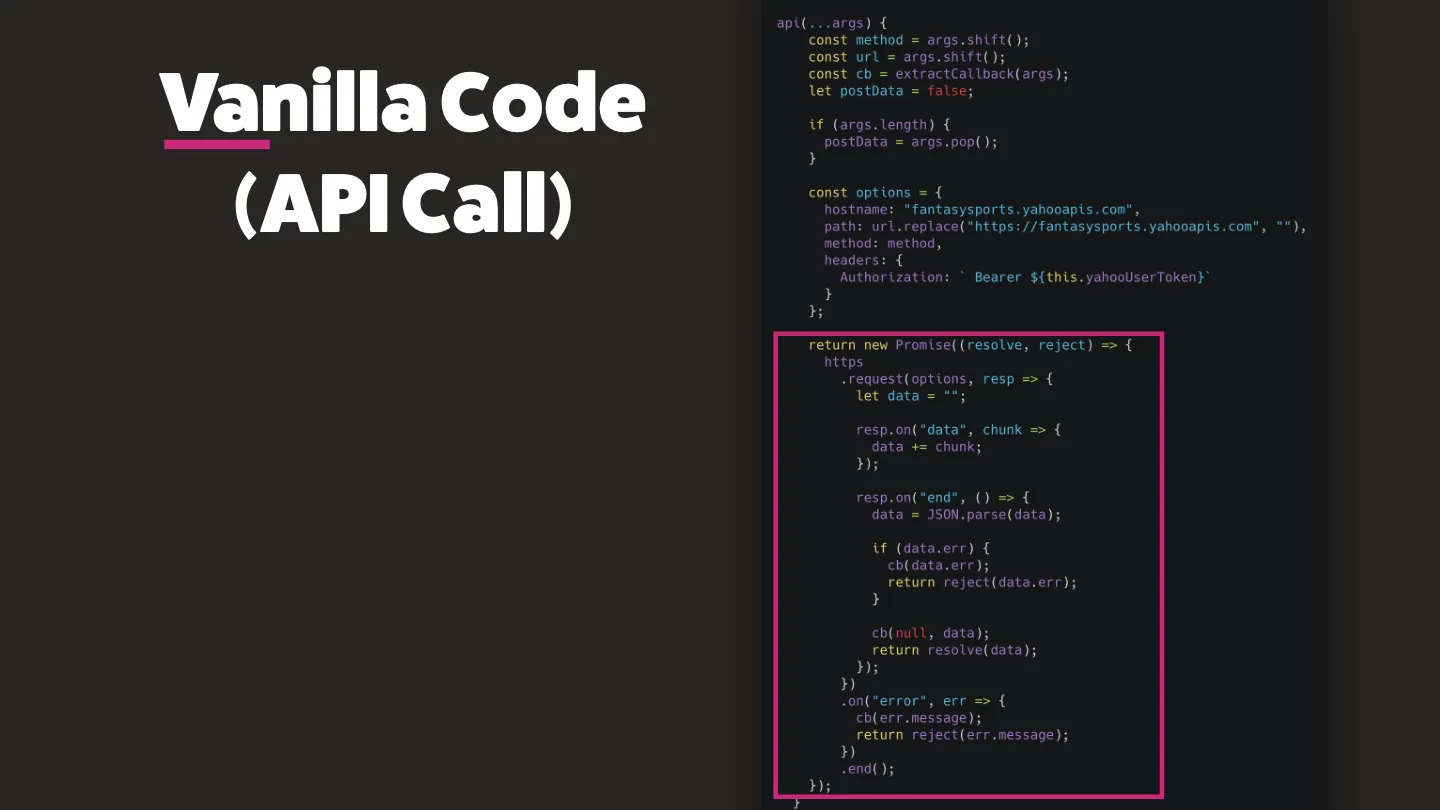
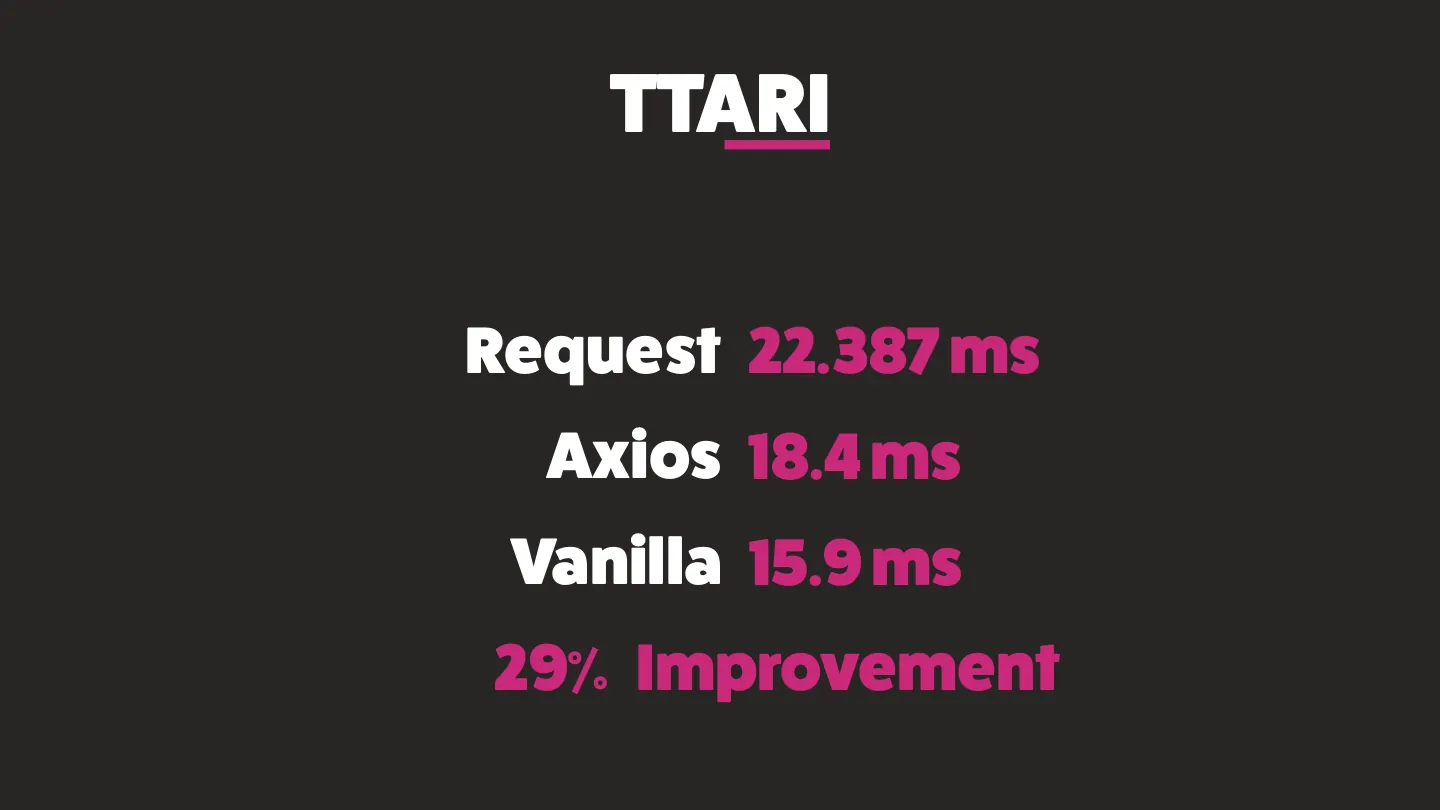
Then I profiled my own open source project, the Yahoo Fantasy Sports API library. I started it in 2014 as a learning project with a hard deadline, so… it was rushed. Using its sandbox, I measured the time from calling the library to the actual request going out:
| Version | Time to request |
|---|---|
Original (request) | 22.4 ms |
| Axios | 18.4 ms (18% faster) |
| Vanilla JS | 15.9 ms (29% faster) |
Twenty-nine percent, just by profiling code I thought I already knew.